
October 14, 2021
LUXURY HOUSING EMERGED FROM THE LOCKDOWNS OF
COVID-19 WITH UNBELIEVABLE STRENGTH AND HAS
REACHED UNPRECEDENTED LEVELS.
In June of last year, housing climbed out of the COVID lockdowns and resurfaced firing on all cylinders. It was as if someone had flipped a switch. Then in 2021, the real estate marked evolved further, from red hot to white hot. Overnight, the real estate industry had become accustomed to throngs of showings, multiple offers, and homes selling for more than their asking prices. A surprising twist was that the luxury housing market surged right along with the lower price ranges and at a record pace.
What sparked the wave of luxury sales? The run-up on Wall Street has certainly helped. After the S&P plunged 32% at the beginning of the pandemic in March 2020, it nearly doubled since, swelling by 94%. It surpassed the prior, pre-COVID, record height in August 2020. The record low interest rate environment is a key factor in luxury’s elevated demand as well. And, the inventory crisis does not only include the lower ranges, luxury buyers have been confronted with an extremely limited supply of available homes to purchase.
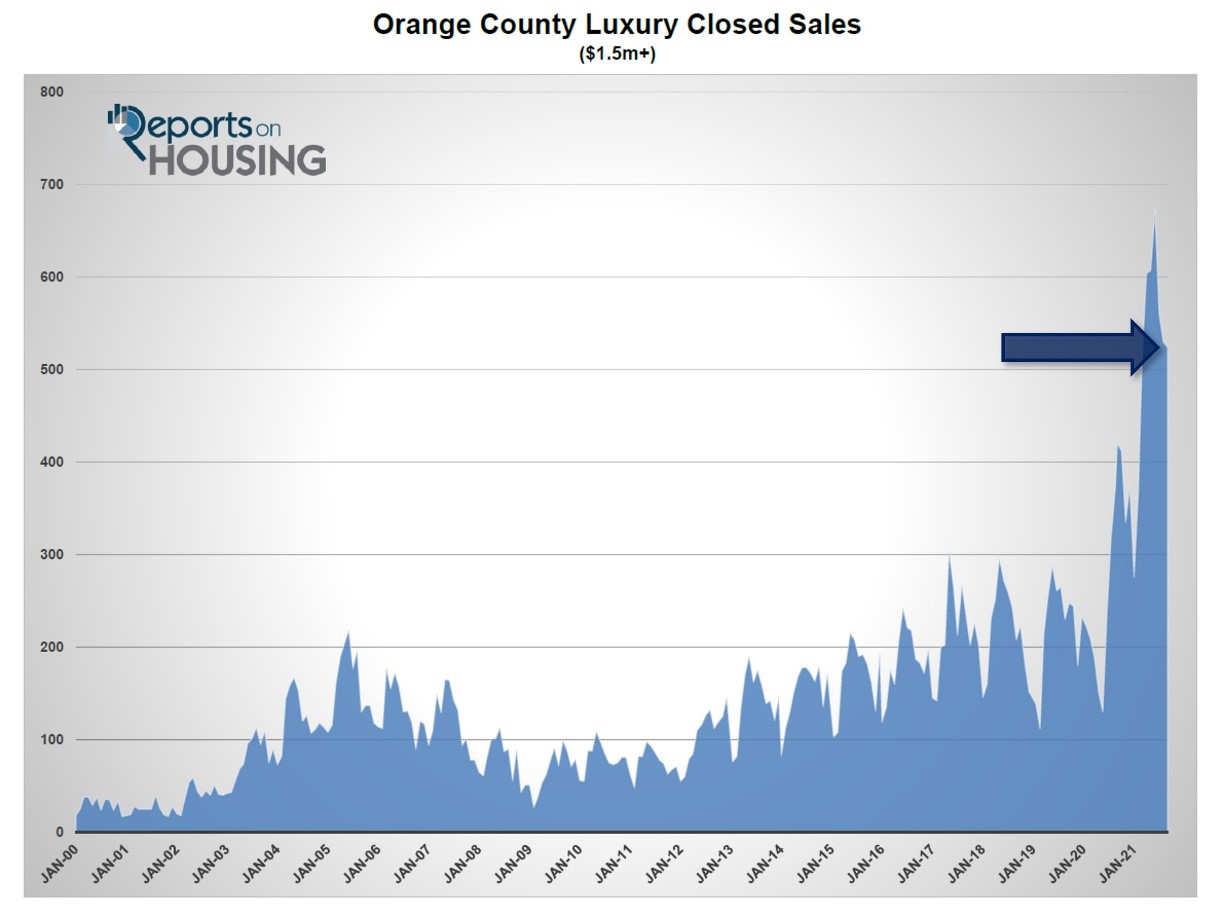
The luxury home market in Orange County, defined as the top 10% of all closed sales, moved from $1.25 million in 2020 to $1.5 million at the start of 2021. In September, there were 524 luxury closed sales. That would be a record level in any other year, but not this year. April through August were all higher, with a 672-peak reached in June. Last year’s record, 420 luxury sales, was achieved in September and surpassed the prior annual record set in June 2017 by 39%. Even with September’s slight seasonal dip in home sales above $1.5 million, it is still 25% higher than last September.
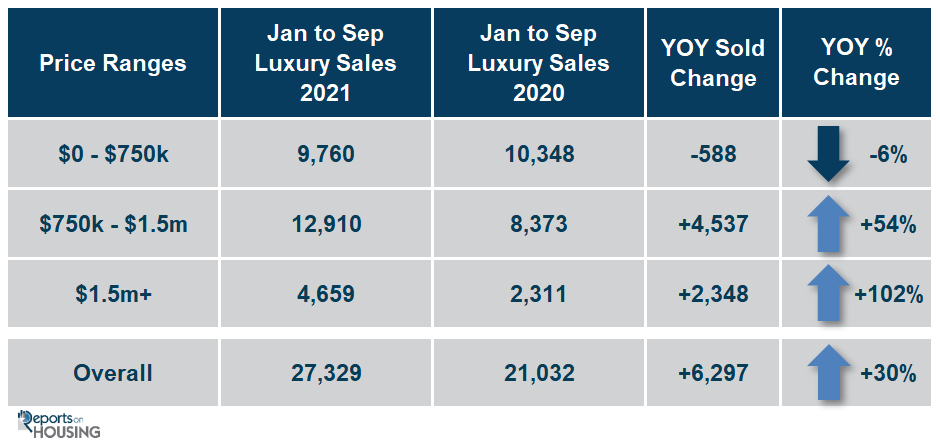
Through September in Orange Country, closed sales are up 30% year-over-year for all price ranges (keep in mind, with a delay in last year’s Spring Market due to COVID, closed sales in 2020 were up sharply July through the end of the year and the peak month was October). At the current pace, sales in 2021 are the highest since 2005, prior to the Great Recession. A deeper look reveals that the higher ranges are performing stronger than the entry level. For homes priced below $750,000, year over year there were 588 fewer closed sales, 6% less. For homes priced between $750,000 and $1.5 million, there were 4,537 additional closed sales compared to last year, 54% higher. And for the luxury range, over $1.5 million, year-over-year there were 2,348 additional closed sales, a shocking 102% more, double last year’s record pace.
There are more closed sales in the luxury range than ever before. The torrid pace does not look like it going to abate anytime soon based upon current luxury supply and demand. The supply is down by 45% year-over-year, demand is up by 8%, and the Expected Market Time is down from 101 days last year to 51 days today. Last year’s low, 95 days, was achieved in September and, at the time, was the lowest market time level ever for homes priced above $1.5 million in Orange County, extremely hot for luxury. That puts today’s 51-day level into proper perspective. The pace of luxury is mind-blowing.
The housing market has been nothing short of insane, and luxury is no exception. With home values surging, the top 10% of the market is rapidly changing. Starting in 2022, in looking back at all 2021 closed sales, luxury will become all homes priced above $2 million in Orange County.
A warning to luxury sellers: luxury may be hotter than ever before, but it still is not as hot as the lower price ranges. It takes a little bit longer to sell homes priced above $2 million. It is not an “instant market” like everything priced below $2 million. There are not as many multiple offer situations, there are fewer showing, and fewer homes sell above their asking prices.
Active Listings
The current active inventory plunged by 6% in the past two weeks.
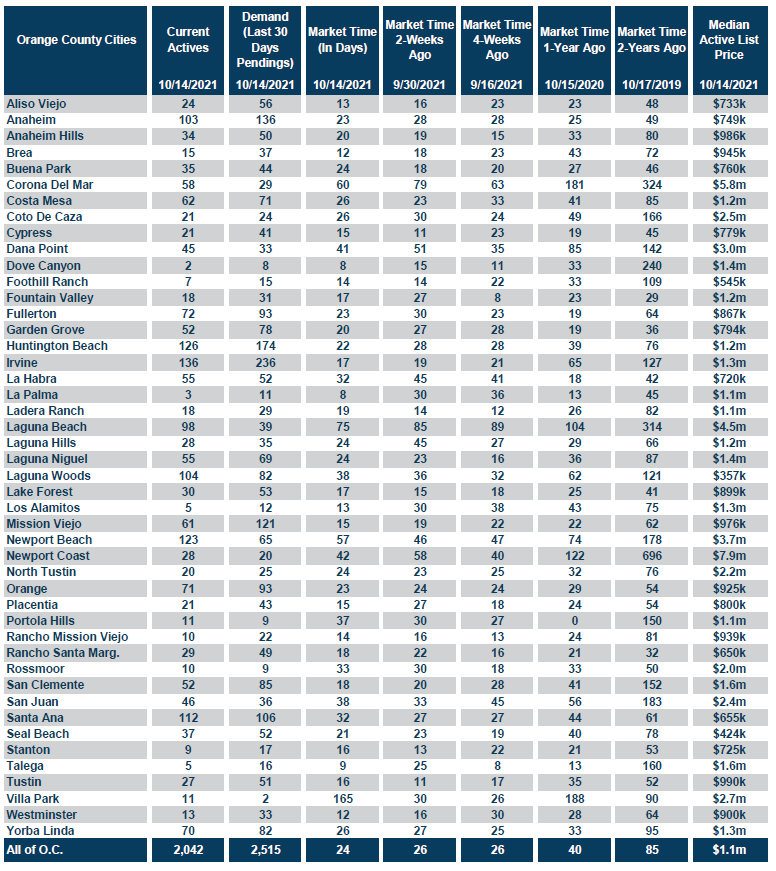
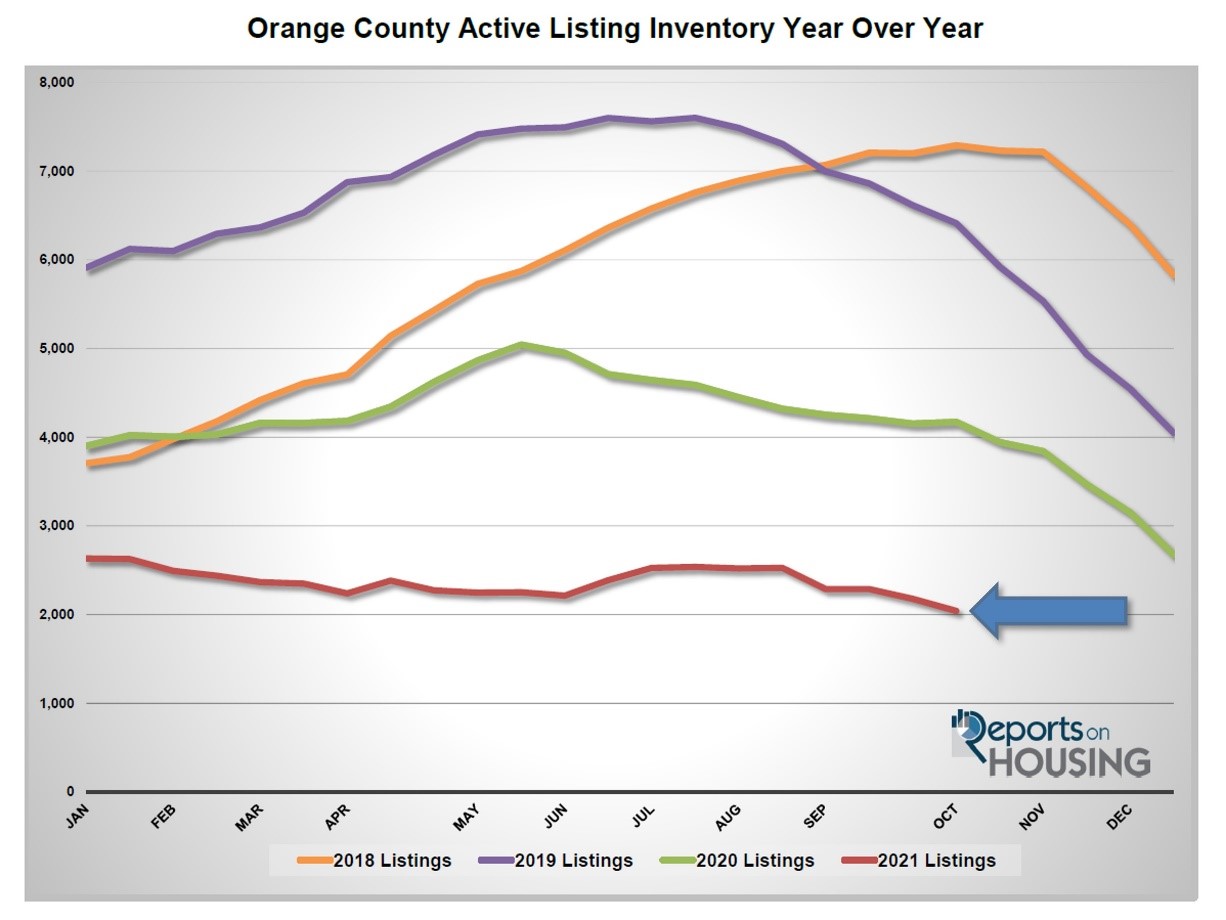
The active listing inventory shed 137 homes in the past couple of weeks, down 6%, and now sits at 2,042 homes, the lowest level since tracking began in 2004 and poised to drop below 2,000 homes in the coming weeks. There are fewer homes right now than there were at the start of this year, one of the craziest years for Orange County real estate on record. The supply crisis will only become more acute and intensify as the year rolls to an end. November and December are cyclically the lowest months of the year for the average number of homes placed on the market, and this year will not be an exception. Plus, many unsuccessful sellers will throw in the towel and choose to enjoy the holidays. How many unsuccessful sellers are there in today’s insanely Hot Seller’s Market? Surprisingly, 852 sellers, 42% of the active inventory, have been on the market for over a month. They are prime candidates to throw in the proverbial towel.
Last year to in mid-October, there were 4,173 homes on the market, 1,974 additional homes, or 104% more, double today’s level. The 3-year average from 2017 to 2019 (intentionally omitting 2020 due to COVID skewing the data) is 6,306, an extra 4,264 homes, or 209% more, triple compared to today. There were a lot more choices back then.
For September, there were 314 fewer new FOR-SALE signs in Orange County compared to the 3-year average from 2017 to 2019, 10% less. Every single missing sign just adds to the inventory crisis.
Demand
Demand was nearly unchanged in the past couple of weeks.
Demand, a snapshot of the number of new pending sales over the prior month, decreased from 2,521 to 2,515 in the past couple of weeks, shedding 6 pending sales, nearly unchanged. Demand typically drops about 2% during this time of the year. Today’s strong demand reflects the low mortgage rate environment. According to Freddie Mac’s Primary Mortgage Market Survey®, mortgage rates have been hovering around 3% for a few weeks now. Low rates continue to juice the market. Despite demand remaining elevated, as fewer homes enter the fray, expect demand to drop with fewer opportunities to purchase. It will slowly drop from now through mid-November, prior to Thanksgiving, and then it will plunge during the Holiday Market and reach its lowest level of the year upon ringing in the New Year.
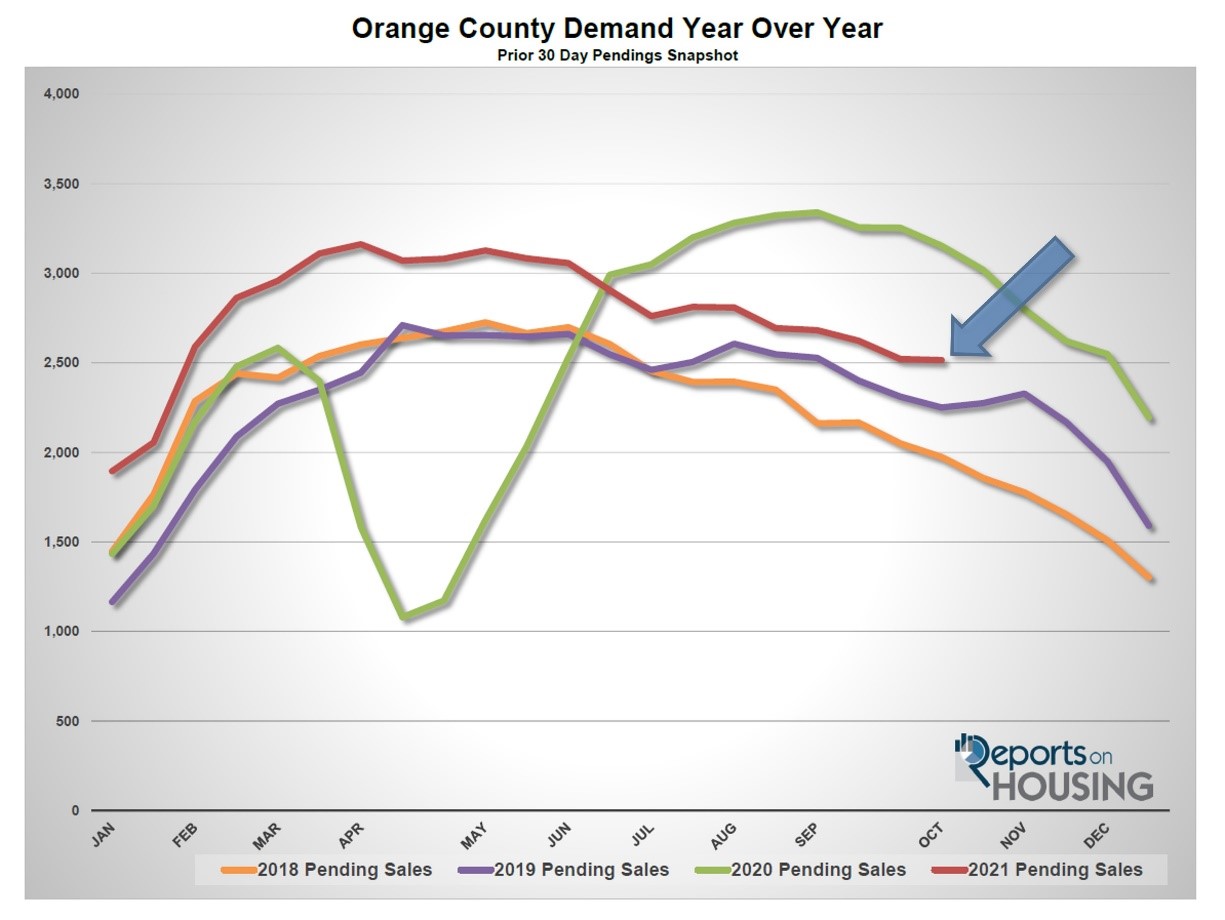
Last year, demand was at 3,153, 25% more than today due to a delay in the Spring Market because of COVID.
With a significant drop in the supply and no real change in demand, the Expected Market Time (the number of days to sell all Orange County listings at the current buying pace) dropped from 26 to 24 days, an extremely insane, HotSeller’s Market (less than 60 days) where there are a ton of showings, sellers get to call the shots during the negotiating process, multiple offers are the norm, and home values are rising rapidly. Last year the Expected Market Time was at 40 days. The 3-year average from 2017 through 2019 was at 87 days, much slower than today, but still a Slight Seller’s Market.
Luxury End
The luxury market slowed slightly with a drop in demand in the past couple of weeks.
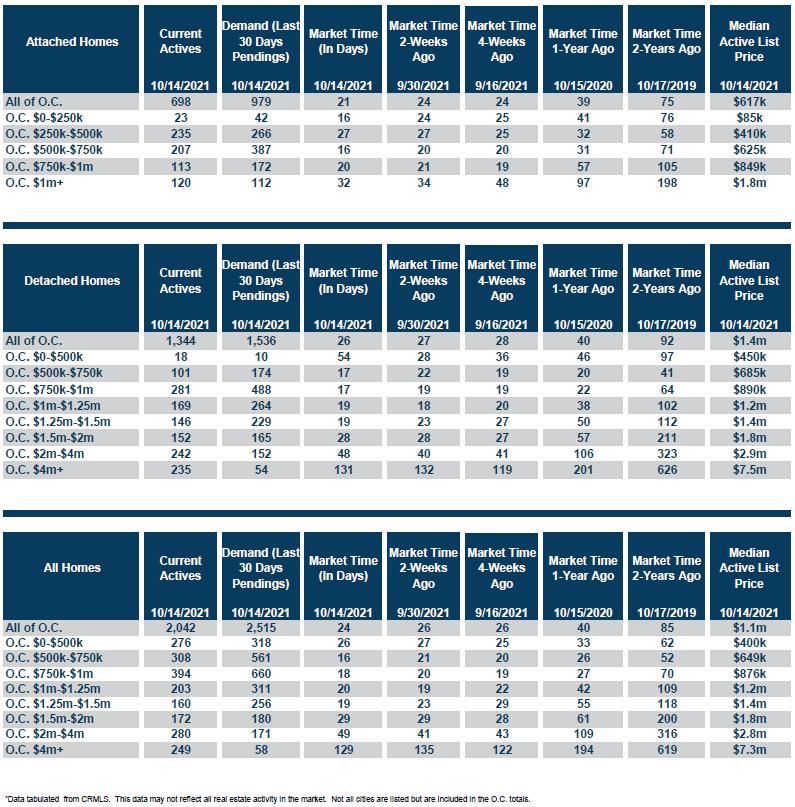
In the past two weeks the luxury inventory of homes priced above $1.5 million increased by 8 homes, up 1%, and now sits at 701. Luxury demand decreased by 23 pending sales, down 5%, and now sits at 432, its lowest level since February. With a large drop in demand, the overall Expected Market Time for luxury homes priced above $1.5 million increased from 48 to 51 days, still a very Hot Seller’s Market for luxury.
Expect the luxury market to slightly cool as housing transitions further into the Autumn Market.
Year over year, luxury demand is up by 233 pending sales or 132%, and the active luxury listing inventory is down by 31 homes or 8%. The Expected Market Time last year was at 101 days, extremely hot for luxury, but double where it is right now, indicating just how hot the luxury market is today. For homes priced between $1.5 million and $2 million, the Expected Market remained unchanged at 29 days. For homes priced between $2 million and $4 million, the Expected Market Time increased from 41 to 49 days. For homes priced above $4 million, the Expected Market Time decreased from 135 to 129 days. At 129 days, a seller would be looking at placing their home into escrow around February 2022.
Orange County Housing Summary
- The active listing inventory shed 137 homes in the past two weeks, down 6%, and now totals 2,042 homes, its lowest level since tracking. In September, there were 10% fewer homes that came on the market compared to the 3-year average between 2017 to 2019 (2020 was skewed due to COVID-19), 314 less. Last year, there were 4,173 homes on the market, 2,131 additional homes, or 104% more.
- Demand, the number of pending sales over the prior month, decreased by 6 pending sales in the past two weeks, nearly unchanged, and now totals 2,515. Last year, there were 3,153 pending sales, 25% more than today due to a delay in the Spring Market because of COVID.
- With large drops in the supply, the Expected Market Time, the number of days to sell all Orange County listings at the current buying pace, decreased from 26 to 24 days in the past couple of weeks, an extremely Hot Seller’s Market (less than 60 days). It was at 40 days last year, slower than today.
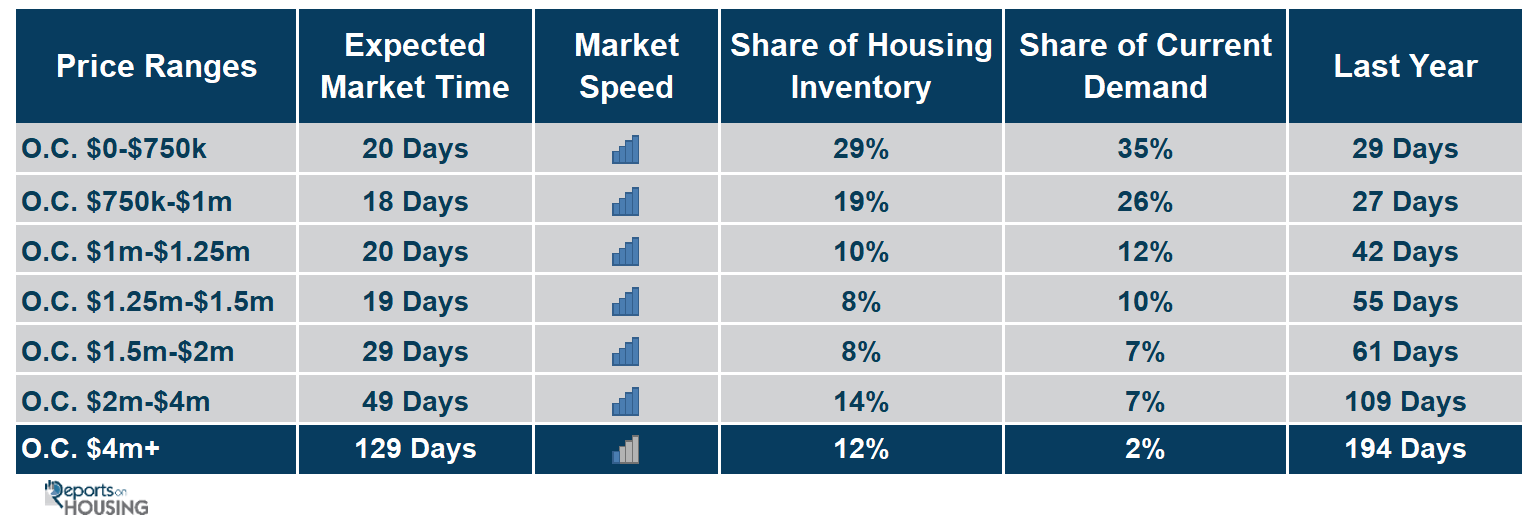
- For homes priced below $750,000, the market is a Hot Seller’s Market (less than 60 days) with an Expected Market Time of 20 days. This range represents 29% of the active inventory and 35% of demand.
- For homes priced between $750,000 and $1 million, the Expected Market Time is 18 days, a Hot Seller’s Market. This range represents 19% of the active inventory and 26% of demand.
- For homes priced between $1 million to $1.25 million, the Expected Market Time is 20 days, a Hot Seller’s Market. This range represents 10% of the active inventory and 12% of demand.
- For homes priced between $1.25 million to $1.5 million, the Expected Market Time is 19 days, a Hot Seller’s Market. This range represents 8% of the active inventory and 10% of demand.
- For homes priced between $1.5 million and $2 million, the Expected Market remained unchanged at 29 days. For homes priced between $2 million and $4 million, the Expected Market Time increased from 41 to 49 days. For homes priced above $4 million, the Expected Market Time decreased from 135 to 129 days.
- The luxury end, all homes above $1.5 million, accounts for 34% of the inventory and 16% of demand.
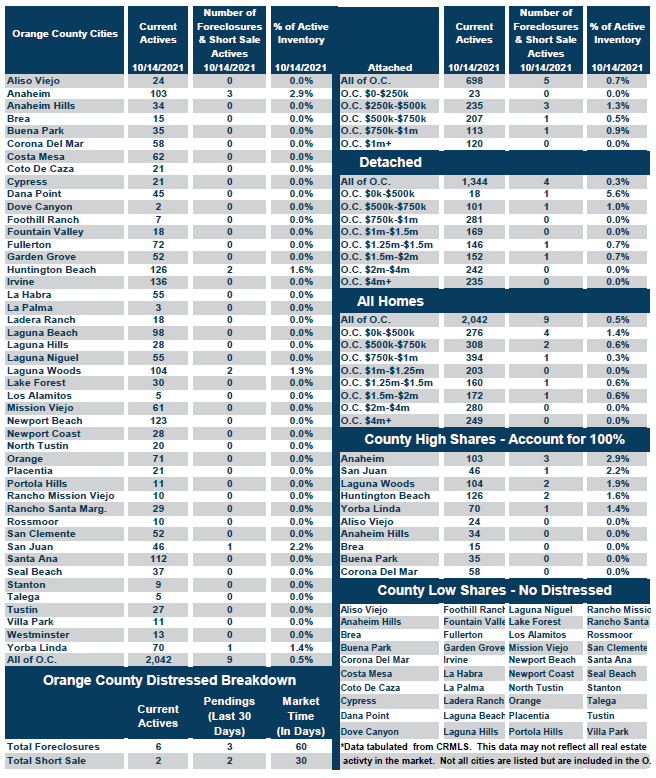
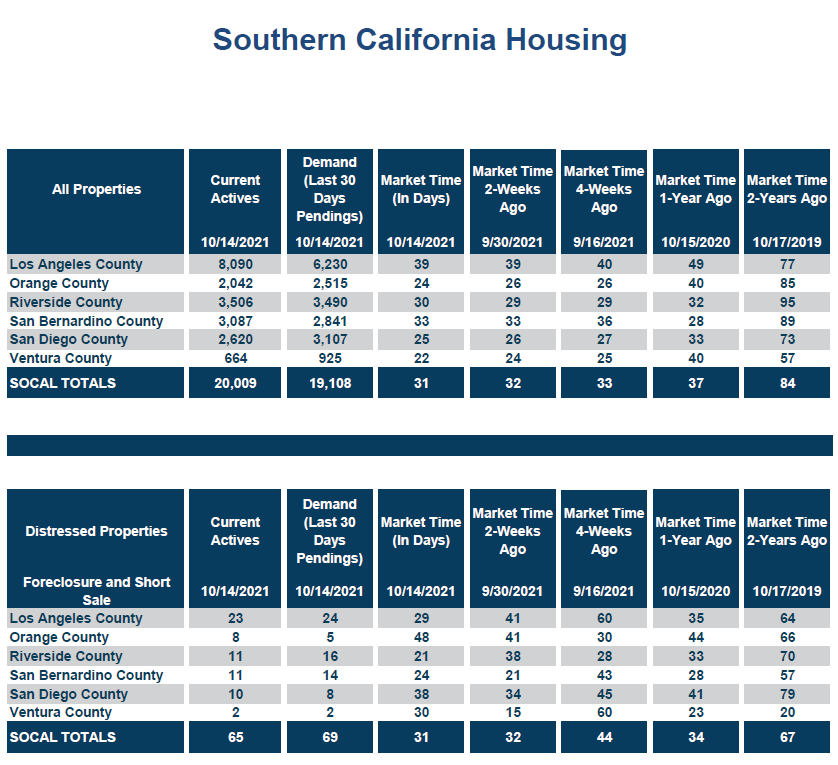
- Distressed homes, both short sales and foreclosures combined, made up only 0.5% of all listings and 0.3% of demand. There are only 8 foreclosures and 3 short sales available to purchase today in all of Orange County, 11 total distressed homes on the active market, up 2 from two weeks ago. Last year there were 16 total distressed homes on the market, similar to today.
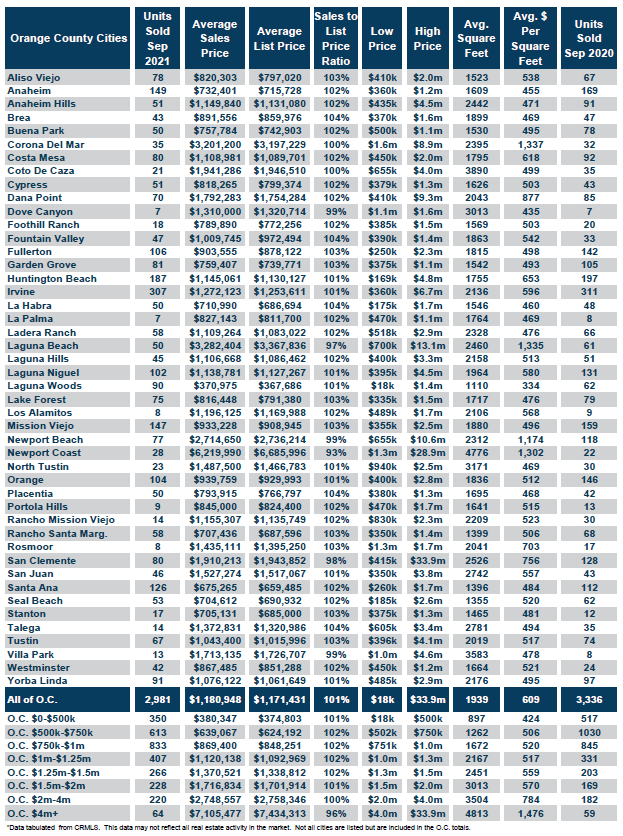
There were 2,981 closed residential resales in September, 11% less than August 2020’s 3,336 closed sales. September marked a 4% drop compared to August 2021. The sales to list price ratio was 100.8% for all of Orange County. Foreclosures accounted for just 0.1% of all closed sales, and short sales accounted for 0.1%. That means that 99.8% of all sales were good ol’ fashioned sellers with equity.
Have a great week.
Sincerely,
Steven Thomas
Quantitative Economics and Decision Sciences
Cell 949.874.8221
Copyright 2021- Steven Thomas, Reports On Housing – All Rights Reserved. This report may not be reproduced in whole or part without express written permission by author.