April 17, 2023
With the number of available homes to purchase at extremely low levels, there simply are too many buyers competing against each other despite high mortgage rates.
A Seller’s Market
When the Expected Market Time drops below 40 days, the housing market leans heavily in favor of sellers.
A three-bedroom, two-and-a-half bathroom, 2,100 square foot home on a 3,700 square foot lot, built in 2003, was placed on the market on the second Tuesday of March at $1,099,000. There was a steady stream of buyers during a three-hour window on Saturday and a two-hour window on Sunday. By Monday evening, more than 20 offers were submitted to the listing agent. The seller countered all offers and asked them to return with their highest and best price. The home closed during the second week of April at $1,145,000, an astonishing 4% above its list price.
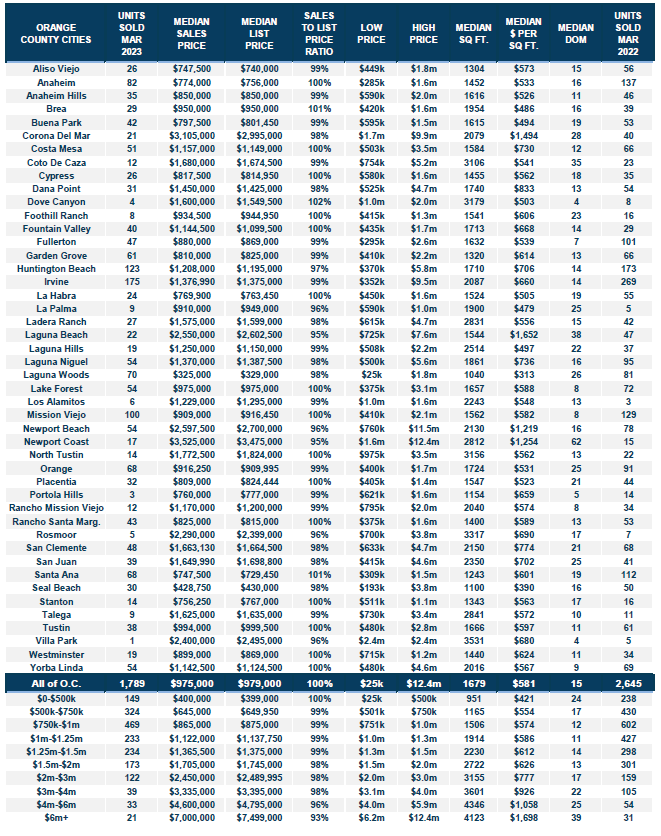
Not every home sells above the asking price, especially in today’s high mortgage rate environment. The sales-to-list price ratio for detached homes priced below $2 million so far in April is 99.9%. For luxury homes, anything priced above $2 million (the top 10% of closings), it drops to 94%. The median time on the market is nine days, a little over a week. It would probably be even faster, but there are too many offers for many sellers to sift through.
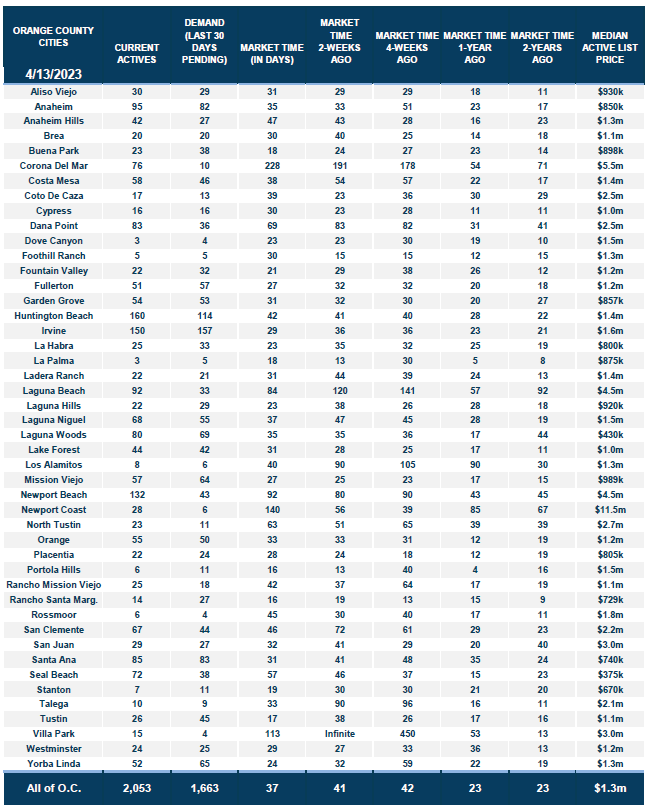
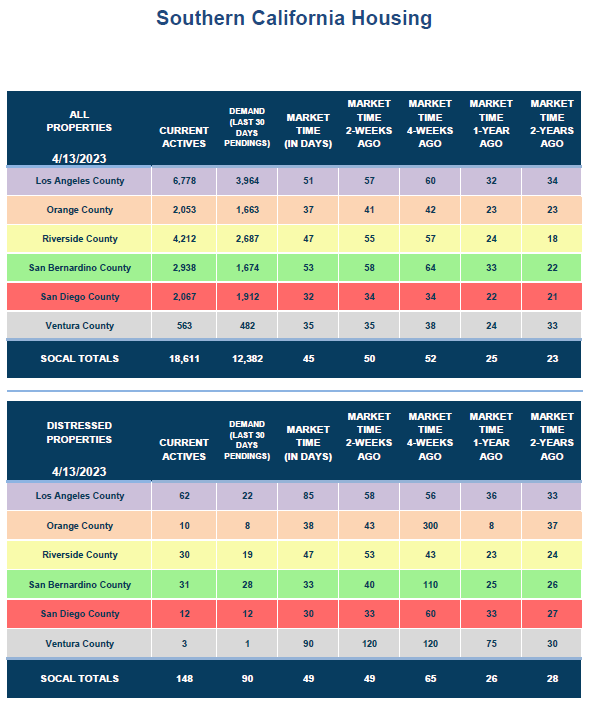
The Expected Market Time, the time between coming on the market and opening escrow, is a function of supply, the number of available homes, and demand, a snapshot of recent pending sales activity. Typically, the inventory slowly grows from January through March and then picks up steam during the spring. This year, the inventory dropped from 2,530 in January to 2,053 today, plunging by 19%. The 3-year average mid-April inventory before COVID (2017 to 2019) was 5,780, an unbelievable 182% higher than today. Demand has increased from 900 pending sales to 1,663 today, an 85% rise. The 3-year pre-COVID average was 2,777, 67% higher than today, its lowest level for mid-April since 2020, during the initial pandemic lockdowns. Demand readings are down because of higher rates and fewer homes available to place into escrow.
Despite muted demand readings, the Expected Market Time has dropped like a rock. With the inventory dropping while demand expands, market times continue to fall. It was 84 days in January and has sunk to 37 days today, plunging below 40 days for the first time since May 2022. The housing market feels hot when the market time dips below 60 days. Buyers can no longer take their time. Housing lines up in the seller’s favor, and home values are sticky and no longer falling even with mortgage rates in the mid 6’s. When a home is accurately priced, and in good condition, it acquires instant attention and sells fast. When market times drop below 40 days, the housing market feels insane. This is when sellers get to call all of the shots, home values are rising again, multiple offers are the norm, sales prices often exceed their asking prices, and homes last only days on the market.
Buyers entering the market today are blown away at just how fast homes that are in good condition and priced according to their Fair Market Values are flying off the market with dozens of offers to purchase. Open houses are bursting at the seams. In some cases, inspection and appraisal contingencies are once again being waived like they were when mortgage rates were below 3%.
Today’s 37-day Expected Market Time means that housing has once again dipped below the level where the pace is unreal. It was at 23 days in both 2021 and 2022 when home values were skyrocketing higher. In 2013, the Expected Market Time was at 33 days, the only year before COVID that reached the white-hot level for housing. The six-year average from 2014 to 2019 for this time of year was 61 days, much different than the current insane pace. With patience, buyers could isolate a home within a reasonable amount of time and were not competing against so many buyers writing offers on nearly every home.
There is nothing available for buyers to purchase right now. Anything that does hit the market is inundated with showings and plenty of offers as long as the home is in reasonable shape and the seller is not stretching the asking price. There is nothing spectacular about the number of buyers looking to purchase today. Today’s insane pace is not a function of juiced demand. The issue is that there are only 2,053 homes available today in the middle of April when there are typically around 5,800 (the 3-year average between 2017 to 2019). The lack of FOR-SALE signs in every community is why today’s housing market is insane.
Housing insanity has returned to Orange County, and it will not change anytime soon.
Active Listings
The active inventory plunged by another 4% in the past couple of weeks.
The active listing inventory decreased by 89 homes in the past two weeks, down 4%, and now sits at 2,053 homes, its lowest level since April last year. Last year’s 1,732 home inventory was the lowest in mid-April since tracking began in 2004, with only 321 fewer than today. By the end of the month, the inventory could dip below last year’s level as it was increasing briskly due to the rapid rise in rates. At this time of year, the 3-year average before COVID (2017 to 2019) was a 4.5% increase in the inventory, not a 4% drop. The limited number of available homes to purchase, amplified by fewer homeowners willing to sell, has resulted in a housing market that has been growing hotter each week. With fewer sellers coming to market, spring demand is eating into the low supply of available homes, preventing the inventory from rising. Do not expect the inventory to grow much during the Spring Market, now through the end of May.
Last year, the inventory was 1,732, 16% lower, or 321 fewer. The 3-year average before COVID (2017 through 2019) is 5,780, an additional 3,727 homes, or 182% extra, nearly triple where it stands today.
Homeowners continue to “hunker down” in their homes, unwilling to move due to their current underlying, locked-in, low fixed-rate mortgage. The difference between their underlying rate and today’s prevailing rate is significant and precludes many homeowners from listing their homes for sale and moving to another house. This will continue until mortgage rates drop. For March, 2,143 new sellers entered the market in Orange County, 1,346 fewer than the 3-year average before COVID (2017 to 2019), 39% less. These missing signs counter any potential rise in the inventory.
Demand
Demand jumped by 7% in the past couple of weeks.
Demand, a snapshot of the number of new escrows over the prior month, increased from 1,560 to 1,663 in the past couple of weeks, up 103 pending sales, or 7%. It was the largest rise since February. Today’s level is still the lowest for mid-April since 2020, during the initial COVID lockdowns. Demand readings are down because of interest rates floating in the mid 6’s, yet they are artificially low due to a muted number of homes coming on the market. If more homes were available, pending sales would rise. Buyers cannot buy what is not available. This scarcity of homes will continue as long as rates remain elevated. Homeowners who are not willing to sell due to their low fixed mortgage rates are going to stay put until rates drop enough to entice them to finally make a move. This will not occur until rates drop to the mid 5’s. Expect demand to slowly rise through May, the Spring Market, as nearly everything on the market is placed right into escrow.
Last year, demand was at 2,241, 35% more than today, or an extra 578. The 3-year average before COVID (2017 to 2019) was 2,777 pending sales, 67% more than today, or an additional 1,114.
With a falling supply and rising demand, the Expected Market Time (the number of days to sell all Orange County listings at the current buying pace) decreased from 41 to 37 days in the past couple of weeks, its lowest level since May 2022. At 37 days, the market is hotter than the 84-day level to start the year, but this is more of a function of a lack of supply and not record-breaking demand. Last year the Expected Market Time was 23 days, substantially faster than today, and home values were screaming higher. The 3-year average before COVID was 62 days, a slower pace than today.
Luxury End
The luxury market improved in the past couple of weeks.
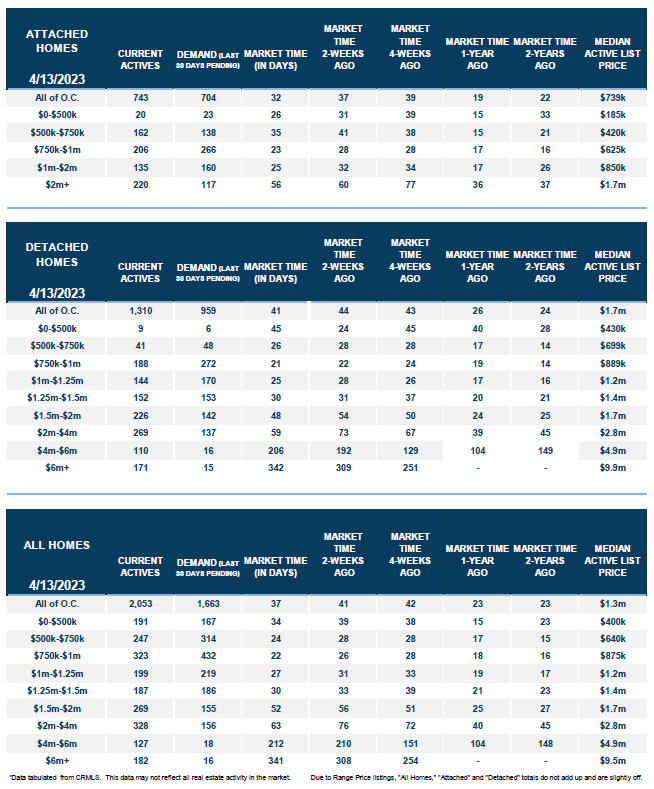
In the past couple of weeks, the luxury inventory of homes priced above $2 million decreased from 639 to 637 homes, down 2 homes, nearly unchanged. Luxury demand increased by 21 pending sales, up 12%, and now sits at 190. With the inventory unchanged and demand rising, the Expected Market Time for luxury homes priced above $2 million decreased from 113 to 101 days, its lowest level since June. Selling luxury homes, especially those above $4 million, is taking a lot longer. With a sales-to-list price ratio of 94%, there is more negotiating room for luxury homes compared to the lower ranges. The market is not at an insane pace for homes above $4 million like in 2021 and the first half of 2022.
Year over year, luxury demand is down by 65 pending sales or 25%, and the active luxury listing inventory is up by 159 homes or 33%. Last year’s Expected Market Time was 56 days, extremely hot for luxury and faster than today.
For homes priced between $2 million and $4 million, the Expected Market Time in the past two weeks dropped from 76 to 72 days. For homes priced between $4 million and $6 million, the Expected Market Time increased from 210 to 212 days. For homes priced above $6 million, the Expected Market Time increased from 308 to 341 days. At 341 days, a seller would be looking at placing their home into escrow around March 2024.
Orange County Housing Summary
- The active listing inventory in the past couple of weeks decreased by 89 homes, down 4%, and now sits at 2,053, the second-lowest mid-March level since tracking began in 2004 behind last year. In March, 39% fewer homes came on the market compared to the 3-year average before COVID (2017 to 2019), 1,346 less. Last year, there were 1,732 homes on the market, 321 fewer homes, or 16% less. The 3-year average before COVID (2017 to 2019) was 5,780, or 182% more.
- Demand, the number of pending sales over the prior month, increased by 103 pending sales in the past two weeks, up 7%, and now totals 1,663. Last year, there were 2,241 pending sales, 35% more than today. The 3-year average before COVID (2017 to 2019) was 2,777, or 67% more.
- With the inventory falling and demand rising, the Expected Market Time, the number of days to sell all Orange County listings at the current buying pace, decreased from 41 to 37 days in the past couple of weeks, its lowest level since May of last year. It was 23 days last year, much stronger than today.
- For homes priced below $750,000, the Expected Market Time decreased from 32 to 27 days. This range represents 21% of the active inventory and 29% of demand.
- For homes priced between $750,000 and $1 million, the Expected Market Time decreased from 26 to 22 days. This range represents 16% of the active inventory and 26% of demand.
- For homes priced between $1 million to $1.25 million, the Expected Market Time decreased from 31 to 27 days. This range represents 10% of the active inventory and 13% of demand.
- For homes priced between $1.25 million to $1.5 million, the Expected Market Time decreased from 33 to 30 days. This range represents 9% of the active inventory and 11% of demand.
- For homes priced between $1.5 million to $2 million, the Expected Market Time decreased from 56 to 52 days. This range represents 13% of the active inventory and 9% of demand.
- For homes priced between $2 million and $4 million, the Expected Market Time in the past two weeks dropped from 76 to 72 days. For homes priced between $4 million and $6 million, the Expected Market Time increased from 210 to 212 days. For homes priced above $6 million, the Expected Market Time increased from 308 to 341 days.
- The luxury end, all homes above $2 million, account for 31% of the inventory and 11% of demand.
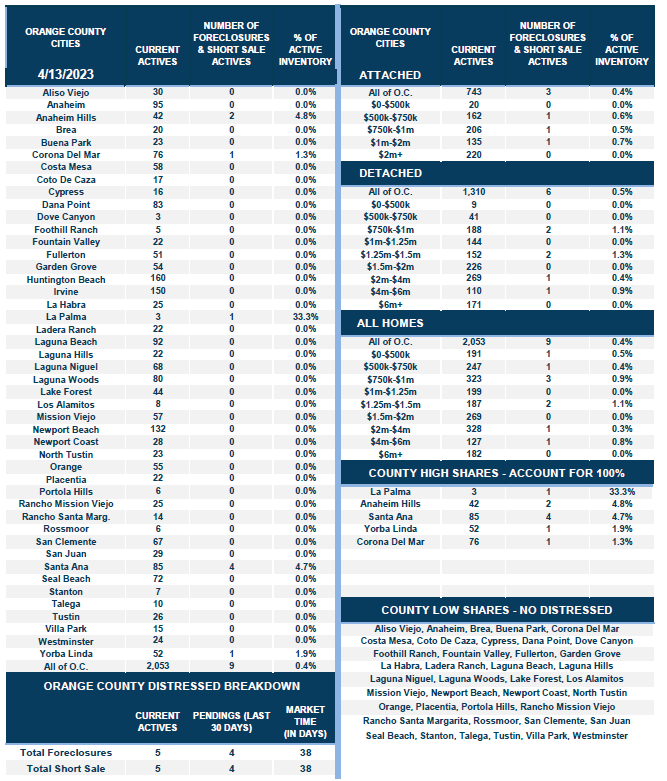
- Distressed homes, both short sales and foreclosures combined, comprised only 0.5% of all listings and 0.5% of demand. Only five foreclosures and five short sales are available today in Orange County, with ten total distressed homes on the active market, unchanged from two weeks ago. Last year there was one distressed home on the market, similar to today.
- There were 1,789 closed residential resales in March, 32% less than March 2022’s 2,645 closed sales. March marked a 41% increase compared to February 2023. The sales-to-list price ratio was 99.6% for all of Orange County. Foreclosures accounted for 0.1% of all closed sales, and there were no closed short sales. That means that 99.9% of all sales were good ol’ fashioned sellers with equity.
Have a great week.
Sincerely,
Steven Thomas
Quantitative Economics and Decision Sciences
Copyright 2023- Steven Thomas, Reports On Housing – All Rights Reserved. This report may not be reproduced in whole or part without express written permission from the author.