
August 9, 2021
Seemingly everyone is expecting a wave of foreclosure due to
forbearance, yet taking a closer look at the facts reveals that
it simply in not going to happen.
The Distressed Market
Fewer homeowners are opting to sell despite homes appreciating to record levels.
Remember the Y2k scare? It was when the calendar year changed from 1999 to 2000, the turn of the century. There were predictions of global chaos because computer programs would reset from ’99 to ’00, making the year 2000 indistinguishable from 1900. The programming error could potentially bring down electric grids, banking, airlines, and cash registers worldwide. Many feared that it would cause a global recession and airplanes would literally fall from the sky. As a result, people stocked up on food, water, backup generators, and withdrew large sums of money in anticipation of the coming catastrophe. Companies and governments worldwide worked with programming experts and took pre-emptive action in the years leading up to January 1, 2000. In the end, contrary to the public expectation, very few errors occurred, and a disaster was averted.
Flash forward to today and the general public fears that the national forbearance program will lead to a wave of foreclosures and cause chaos in today’s sizzling hot real estate market. Everyone has heard of the vast number of homeowners who have turned to forbearance during the pandemic amidst economic shutdowns and slowdowns. Forbearance allowed borrowers to pause their payments. Repayment of the missed payments can be done all at once, with a payment plan, or often deferred to the end of the term of the loan.
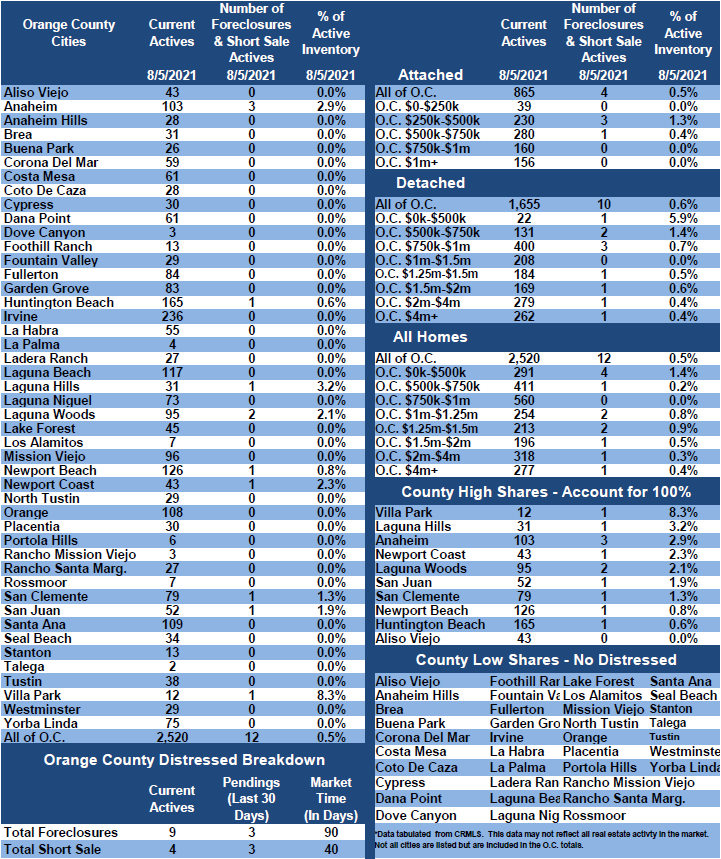
Everyone seems to jump to the plight and struggles of the Great Recession and believe that the housing market is about to repeat itself. Yet, in August 2008, 9.2% of all U.S. mortgages were either delinquent or in foreclosure. By September 2009, it had risen to 14.4%. Today, 3.4% of all mortgages are in forbearance, which amounts to 1.7 million homeowners. The vast majority of those that remain in forbearance will perform and not become a foreclosure or short sale statistic. Why not? It is important to dive a bit deeper and take a look at the huge number who have already exited forbearance.
A total of 7.2 million homeowners have taken advantage of the forbearance program, according to Black Night ®. Over 5.2 million have exited as of mid-June. The vast majority, 90% are either current and paying on time or paid off the balance of the loan in full. Incredibly, 3.4 million, or 65%, are current and paying on time. Another 1.3 million, or 25%, paid
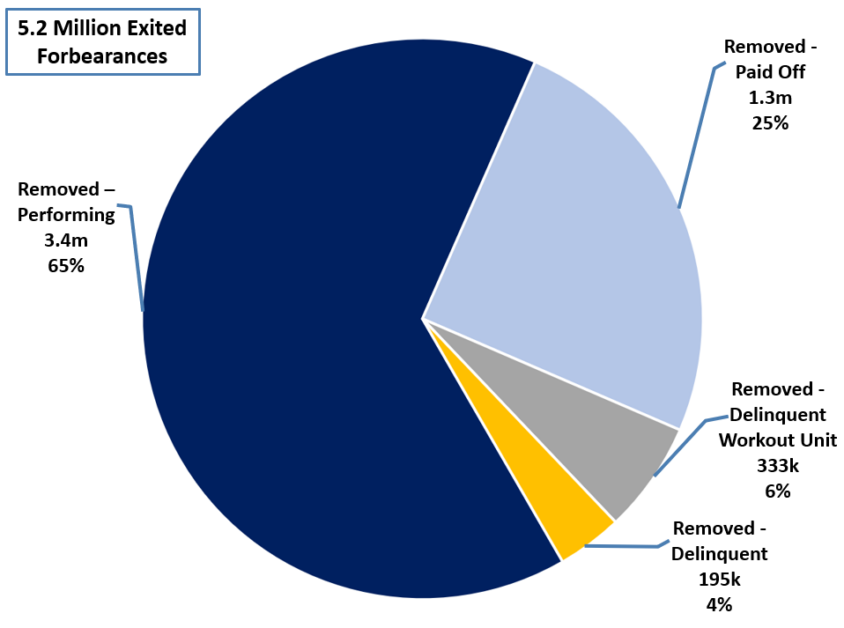
off the mortgage through a refinance or the sale of a home. Only 333,000, or 6%, are delinquent and working with the workout department of their bank to come up with a solution. That leaves 195,000 or 4% that are delinquent and on the road to be coming either a short sale or foreclosure statistic. That is 195,000 across the U.S. out of the 5,200,000 that exited forbearance.
Today, 1.74 million homeowners remain in forbearance. Thanks to the screaming hot housing market and skyrocketing home appreciation, most of these homeowners have plenty of equity to sell their home. 87% have at least 10% equity, more than enough to sell and walk away with net proceeds. The 13% remaining amounts to 221,000 homeowners. Many of them will work out some sort of loan modification with their lenders. Lenders have learned many valuable lessons from the Great Recession and are not at all eager to foreclose. But, even if all 221,000 become a foreclosure along with the 195,000 delinquent that exited forbearance and are not coming up with a solution with their bank’s workout unit, the 416,000 total foreclosures nationally pales in comparison to the nearly 9 million households that lost their homes to a foreclosure or short sale after housing crashed in 2007. The probable number of foreclosures is most likely less than 400,000, which would be easily swallowed up in today’s ferociously hot housing market.
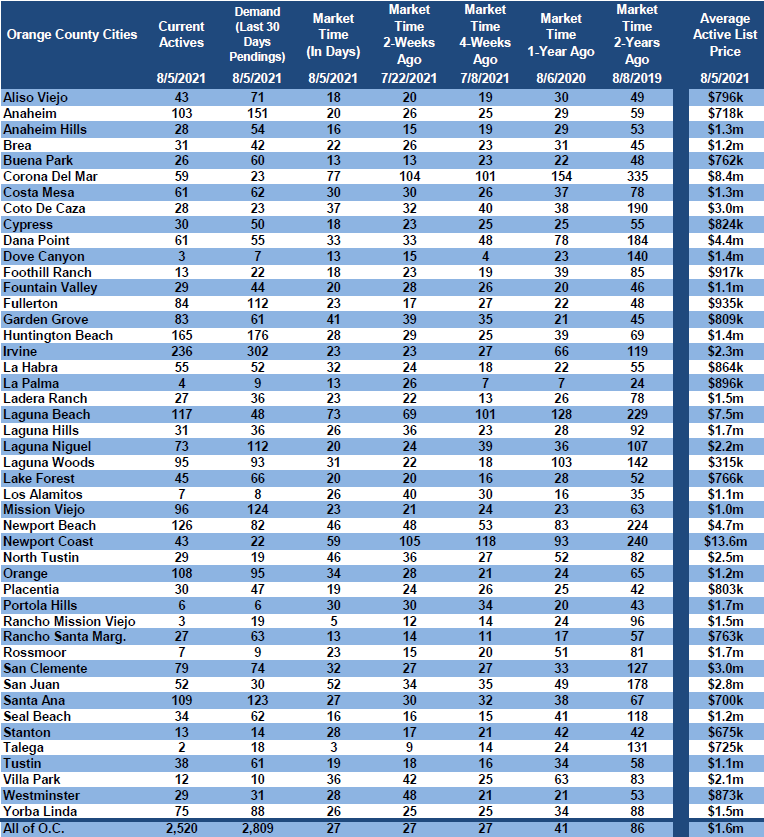
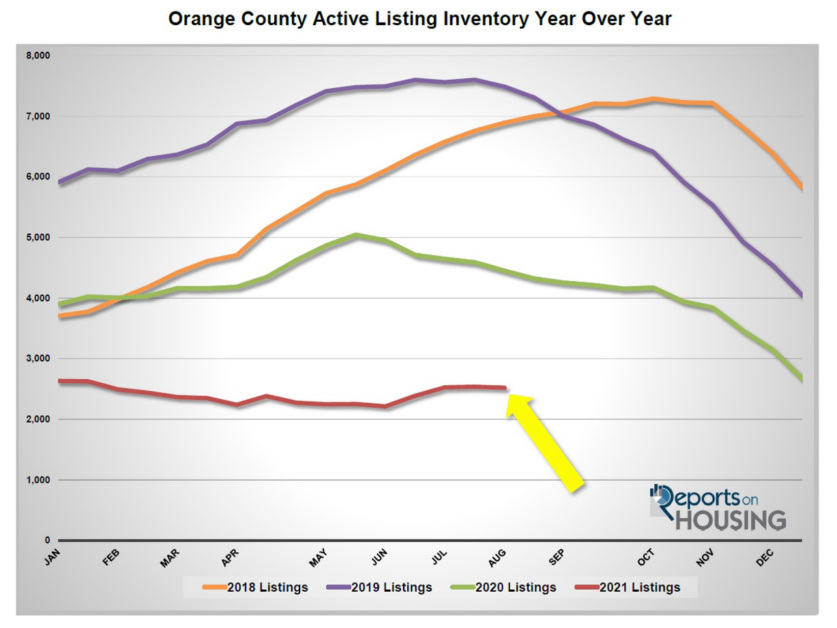
At the start of the Great Recession, the supply of available homes to purchase was way too high, over 6 times where it stands today with only 2,520 homes currently available in Orange County. Placing homes on the market, even foreclosures, when housing is starved for more inventory like it is today, will be easily snapped up in an instant. Buyers would welcome the relief of any additional inventory right now and into the foreseeable future. The plight of not enough homes will linger for the rest of the year and throughout 2022 as well.
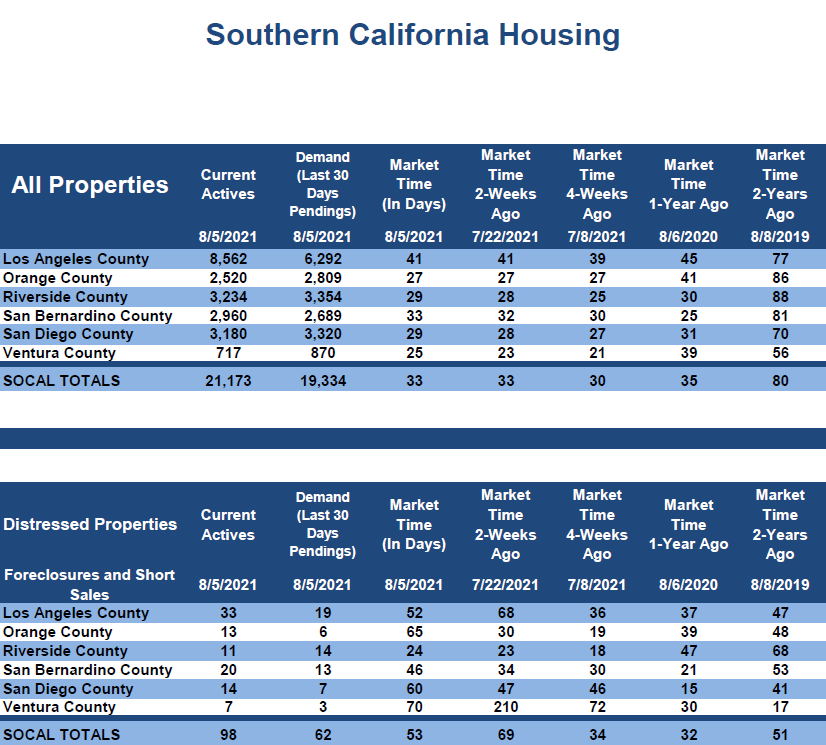
It is also important to note that there are currently only 13 foreclosures and short sales available in all of Orange County, representing 0.5% of the current inventory. Demand (the last 30-days of pending sales) includes only 6 foreclosures and short sales, 0.2% of total demand. When forbearance ends, the numbers will increase from their all-time lows, but the slight rise will be undetectable within the marketplace.
The bottom line: there will be no wave of foreclosures due to forbearance. The sky is not falling. Instead, everyone should expect more of the same. The ultra-low, anemic inventory will remain, and demand will be juiced due to historically low mortgage rates.
Active Listings
The current active inventory dropped by 1% in the past couple of weeks.
The active listing inventory shed 17 homes in the past couple of weeks, down 1%, and now sits at 2,520 homes. Typically, the active listing inventory peaks between July and August, so the recent rises from June through July may have already come to an end. Only time will tell. Back to school shopping is in vogue, meaning the start of the school year is knocking on the door. That is normally when the market transitions into the Autumn Market, where fewer homeowners opt to sell their homes due to the inconvenience of relocating while the kids are in school. This is precisely why the inventory typically falls from the end of August through the end of the year. The drop actually picks up steam during the holidays starting in mid-November. It will be challenging for the inventory to drop much more than where it stands today though, as it is already at unprecedented low levels. At this point, it appears as if the start of 2022 will be a repeat of 2021 with very few homes available.
Last year at the start of August, there were 4,449 homes on the market, 1,929 additional homes, or 77% more. The 5-year average from 2015 to 2019 (intentionally omitting 2020 due to COVID skewing the data) is 6,916, an extra 4,379 homes, or 173% more. There were a lot more choices for buyers compared to today.
Since comparing year over year data in housing is not accurate this year due to COVID-19 skewing the data last year, it is much better to compare current levels to the 3-year average from 2017 to 2019. In July, there were 157 fewer new FORSALE signs in Orange County, 4% less than the 3-year average. While it may not seem like much of a difference, it is still adding to the scarcity of available homes and exasperating the inventory crisis.
Demand
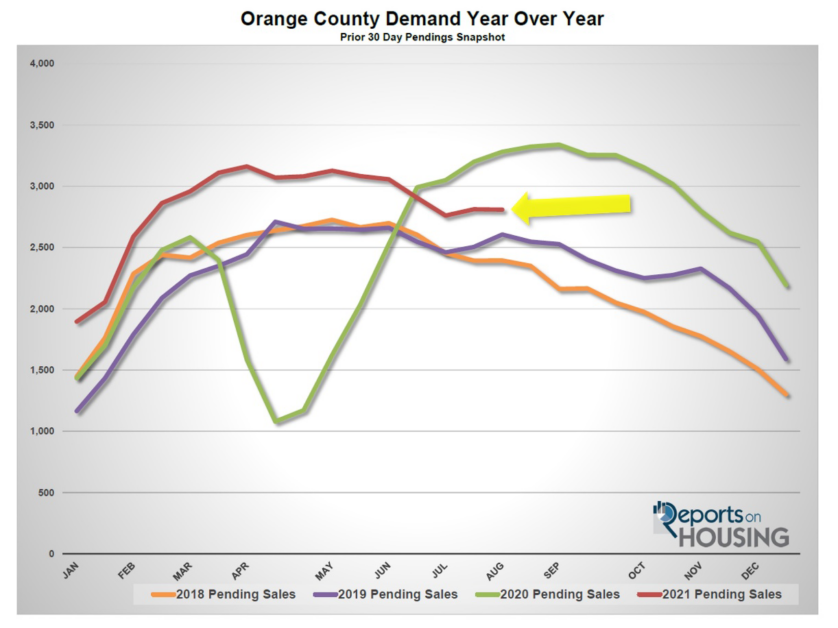
Demand was nearly unchanged in the past couple of weeks.
Demand, a snapshot of the number of new pending sales over the prior month, decreased from 2,812 to 2,809 in the past couple of weeks, shedding 3 pending sales, nearly unchanged. Demand is remaining elevated due to interest rates dropping near its 17th record low since the start of the pandemic of 2.65% established during the first week of January. According to Freddie Mac’s Primary Mortgage Market Survey®, rates had dropped to 2.77% as of August 5th. In comparing today to the 3-year average between 2017 to 2019 (intentionally leaving out 2020 due to COVID-19’s skew on the data), which was at 2,630 pending sales, demand is currently 7% higher, or an extra 179. And, that is being accomplished with an unprecedentedly low inventory. Expect demand to slowly drop from now until mid-November when it picks up steam and drops to the lowest point by year’s end.
Last year, demand was at 3,281 and climbing, 17% more than today, with the arrival of a very late Spring Market due to COVID.
With the not much of a change in either supply or demand in the past couple of weeks, the Expected Market Time (the number of days to sell all Orange County listings at the current buying pace) remained unchanged at 27 days. It has remained at 27 days since the start of a July, an extremely insane, Hot Seller’s Market (less than 60 days) where there are a ton of showings, sellers get to call the shots during the negotiating process, multiple offers are the norm, and home values are rising rapidly. Last year the Expected Market Time was at 43 days and dropping. The 3-year average from 2017 through 2019 was at 78 days, much slower than today, but still a Slight Seller’s Market.
Luxury End
The luxury market did not change much in the past couple of weeks.
In the past two weeks the luxury inventory of homes priced above $1.5 million decreased by 7 homes, down 1%, and now sits at 791. At the same time, luxury demand decreased by 10 pending sale, down 2%, and now sits at 437. With not much of a change in both supply and demand, the overall Expected Market Time for luxury homes priced above $1.5 million remained unchanged at 54 days, a very Hot Seller’s Market for luxury.
Expect the luxury market to slightly cool with all the distractions that occur at the end of summer. It will continue to cool as housing transitions into the Autumn Market.
Year over year, luxury demand is up by 70 pending sales, or 19%, and the active luxury listing inventory is down by 580 homes, or 42%. The Expected Market Time last year was at 112 days and dropping fast due to the delay in the Spring Market due to COVID. Year over year statistics for luxury are a lot more comparable today than they have been for a while. It indicates that today’s luxury market is still the hottest on record.
For homes priced between $1.5 million and $2 million, the Expected Market Time increased from 28 to 31 days. For homes priced between $2 million and $4 million, the Expected Market Time decreased from 55 to 52 days. For homes priced above $4 million, the Expected Market Time decreased from 131 to 128 days. At 128 days, a seller would be looking at placing their home into escrow around December 2021.
Orange County Housing Summary
• The active listing inventory decreased by 17 homes in the past two-weeks, down 1%, and now totals 2,520. In July, there were 4% fewer homes that came on the market compared to the 3-year average between 2017 to 2019 (2020 was skewed do to COVID-19), 157 less. Last year, there were 4,449 homes on the market, 1,929 additional homes, or 77% more.
• Demand, the number of pending sales over the prior month, decreased by 3 pending sales in the past two-weeks, nearly unchanged, and now totals 2,809. Last year, there were 3,281 pending sales, 17% more than today, due to a delayed Spring Market.
• With not much of a change in supply or demand, the Expected Market Time, the number of days to sell all Orange County listings at the current buying pace, remained unchanged at 27 days in the past couple of weeks, an extremely Hot Seller’s Market (less than 60 days). It was at 41 days last year and getting hotter.
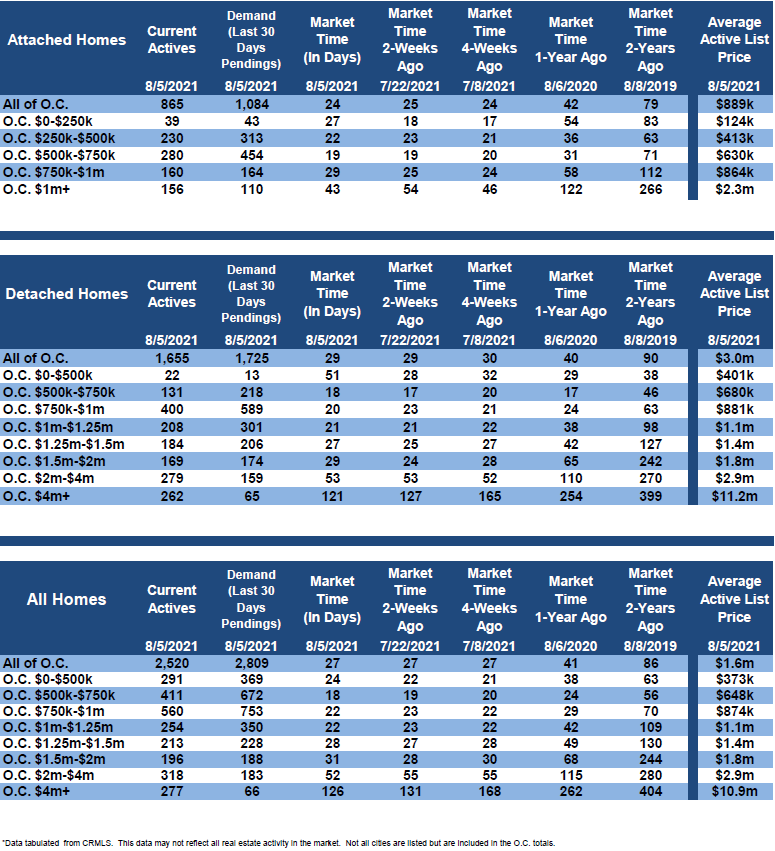
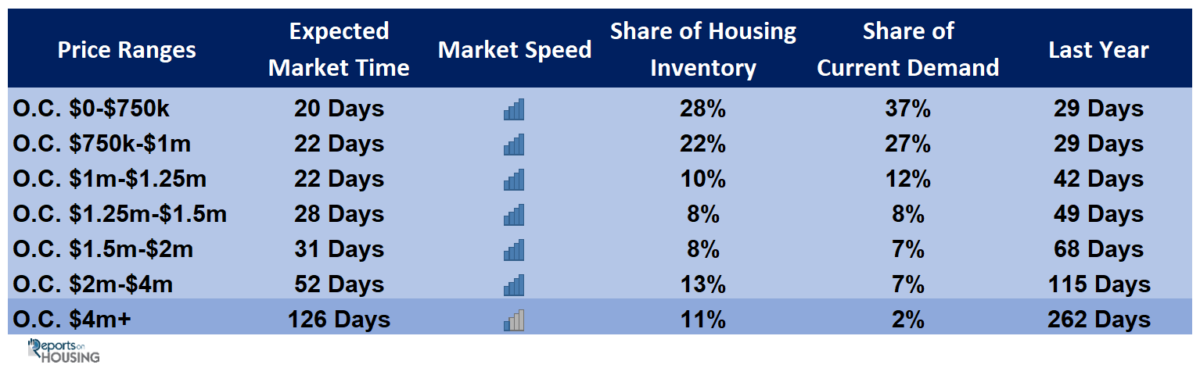
• For homes priced below $750,000, the market is a Hot Seller’s Market (less than 60 days) with an Expected Market Time of 20 days. This range represents 28% of the active inventory and 37% of demand.
• For homes priced between $750,000 and $1 million, the Expected Market Time is 22 days, a Hot Seller’s Market. This range represents 22% of the active inventory and 27% of demand.
• For homes priced between $1 million to $1.25 million, the Expected Market Time is 22 days, a Hot Seller’s Market. This range represents 10% of the active inventory and 12% of demand.
• For homes priced between $1.25 million to $1.5 million, the Expected Market Time is 28 days, a Hot Seller’s Market. This range represents 9% of the active inventory and 9% of demand.
• For homes priced between $1.5 million and $2 million, the Expected Market Time increased from 28 to 31 days. For homes priced between $2 million and $4 million, the Expected Market Time decreased from 55 to 52 days. For homes priced above $4 million, the Expected Market Time decreased from 131 to 128 days.
• The luxury end, all homes above $1.5 million, accounts for 32% of the inventory and 16% of demand.
• Distressed homes, both short sales and foreclosures combined, made up only 0.5% of all listings and 0.2% of demand. There are only 9 foreclosures and 4 short sales available to purchase today in all of Orange County, 13 total distressed homes on the active market, up 1 from two-weeks ago. Last year there were 18 total distressed homes on the market, very similar to today.
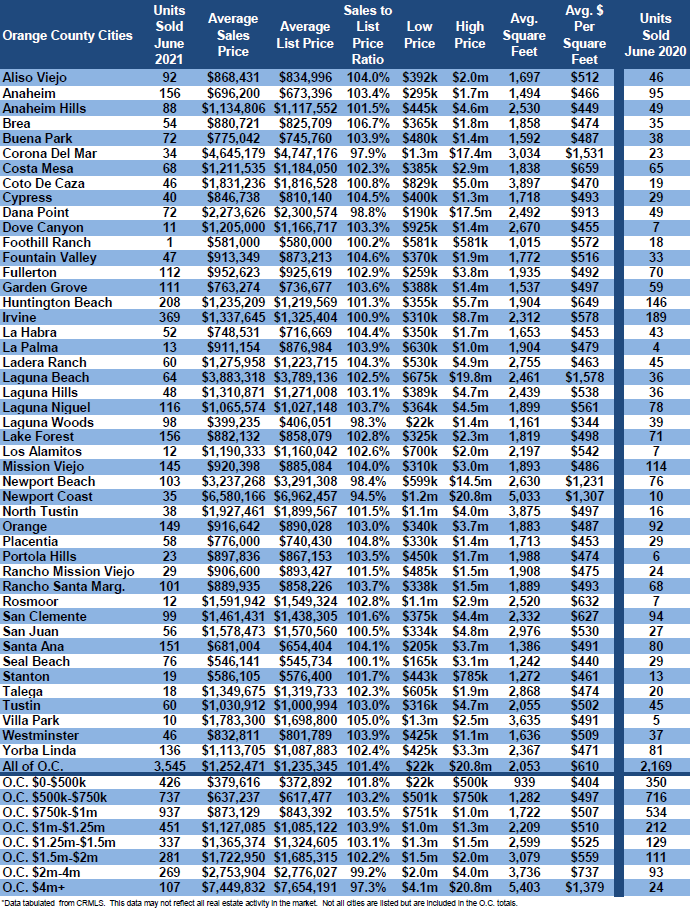
• There were 3,545 closed residential resales in June, 63% more than June 2020’s 2,169 closed sales. June marked a 10% increase compared to May 2021. The sales to list price ratio was 101.4% for all of Orange County. Foreclosures accounted for just 0.1% of all closed sales, and short sales accounted for 0.1%. That means that 99.8% of all sales were good ol’ fashioned sellers with equity.
Have a great week.
Sincerely,
Steven Thomas
Quantitative Economics and Decision Sciences
Cell 949.874.8221
Copyright 2021- Steven Thomas, Reports On Housing – All Rights Reserved. This report may not be reproduced in whole or part without express written permission by author.