Is Housing Unaffordable?

June 1, 2021
As home values rocket upwards, affordability weakens,
yet homes are still not too far out of reach for most buyers
because of low mortgage rates.
Low Rates Prop Up Affordability
Even with record level home prices, low mortgage rates have kept affordability in check.
In 1980, a new car cost around $7,200 and a gallon of gas was $1.19. It was $2.25 for a movie ticket, 15 cents for a first-class stamp, 91 cents for a dozen eggs, and $2.16 for a gallon of milk. Wow! It was cheap living back in 1980. Reminiscing and longing for the good ol’ days leaves out a very important, often overlooked difference, income. The Orange County median household income in 1980 was $22,000, a drop in the bucket compared to today’s $100,000 level.
It boils down to perspective. Looking only at housing prices tells only part of the story. It is important to also consider household incomes and the prevailing mortgage rates. Naysayers are quick to point out how the median sales price was much lower back in prior years; however, taking into consideration both the median income and the average 30-year mortgage rate illustrates how buyers can afford so much more today. The historically low mortgage rate environment has stoked today’s unsatiable demand and has allowed housing to soar over the past year.
To understand where this heightened demand and buyer’s exuberance is coming from it is necessary to consider where interest rates and income have historically been and their impact on affordability. The chart below highlights how higher interest rates limit the price of a home that a buyer can afford. In 1980, the average mortgage rate was 13.75%, the median income was $22,000, and the median detached sales price was $108,000. That meant that the monthly housing payment was 55% of a homeowner’s income. Rates continued to drop and incomes climbed decade after decade. In 2000, mortgage rates were at 8%, the median income grew to $56,000, and the median detached sales price had blossomed to $317,000. Yet, the monthly payment was only 40% of a homeowner’s income. It swelled to 59% in 2007, just prior to the start of the Great Recession, and dropped to 33% in 2012 as housing began to climb once again. Flash forward to today’s 3% mortgage rate, $101,000 median income, and a record setting April median detached sales price of $1,100,000, and the monthly housing payment is 44% of a homeowner’s monthly paycheck.
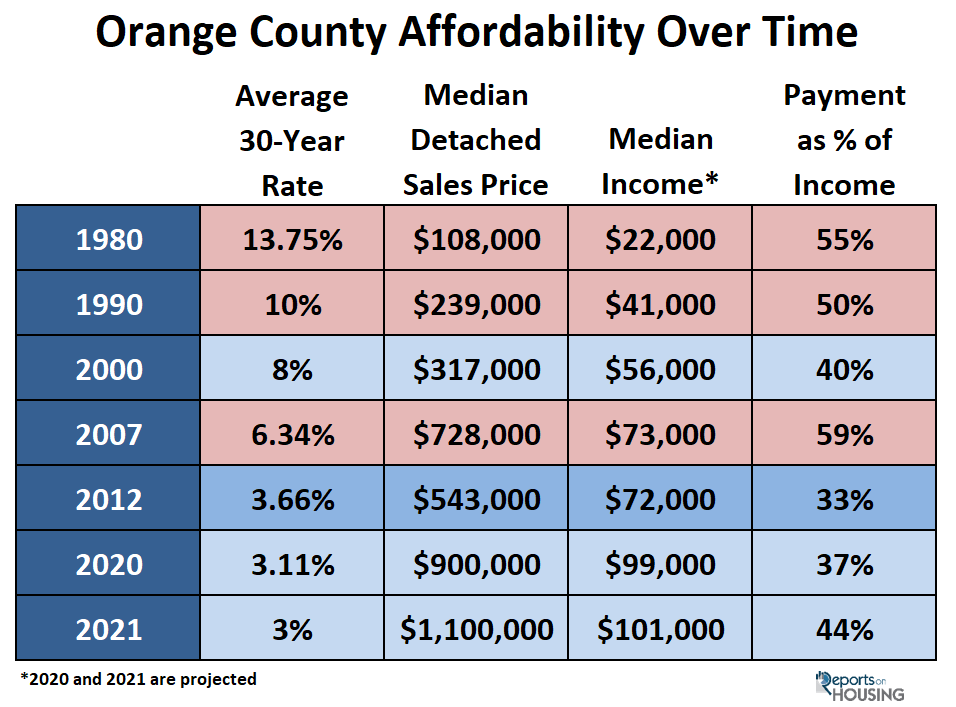
Mortgage rates reached 17 record lows since the start of the COVID-19 pandemic, which dropped the monthly payment substantially. That meant that a much smaller slice of a homeowner’s monthly paycheck went to paying the mortgage payment. It dropped to 37% last year, prompting buyer demand to escalate. As a result, prices surged and incomes have not kept up; thus, affordability eroded and now stands at 44%. But it has climbed to much higher levels in the past. In perspective, today’s level is not yet concerning.
It is important to note that when interest rates do rise down the road, that it will impact affordability considerably. At today’s $1,100,000 median detached sales price and $101,000 household income, a 3.5% rate would result in a monthly payment that would be 47% of a homeowner’s income. At 3.75% it would rise to 49%. Today’s historically low mortgage rates have led to a heightened sensitivity to smaller rises in mortgage rates. As rates rise in the future, the housing market will most certainly downshift.
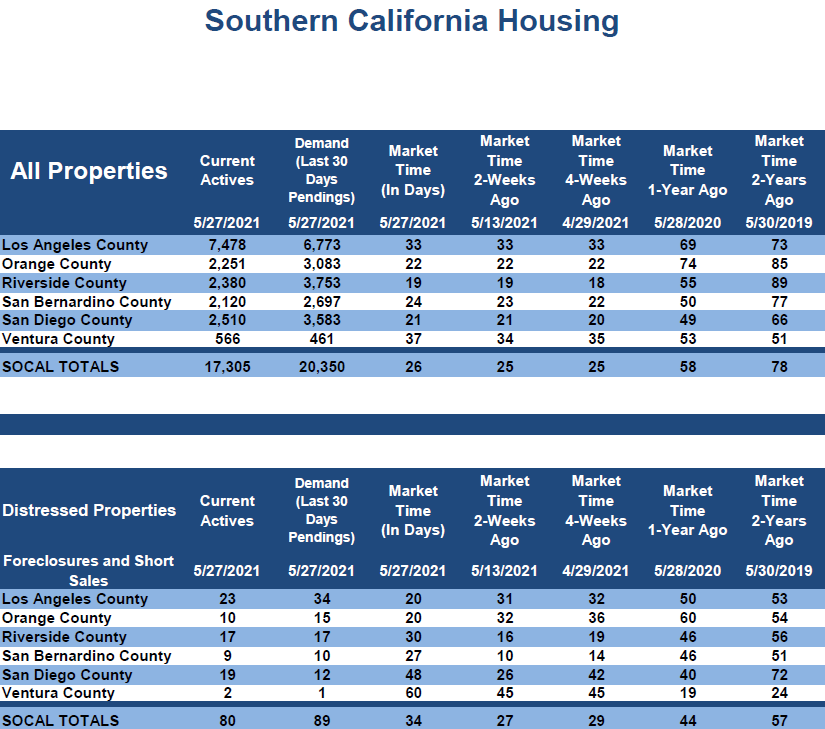
Based upon the number of homes available to purchase today and current, red-hot buyer demand, the Expected Market Time (the time between hammering in the FOR-SALE sign and opening escrow), a snapshot of the speed of the local housing market, has remained at the ultra-low level of 22 days, a scorching Hot Seller’s Market. It is technically a “Hot Seller’s Market” when the market time falls below 60 days. Today’s 22-day level is far below that threshold, indicative of a market with rapid price appreciation, multiple offers, and an auction like atmosphere that results in most homes selling above their asking prices. The current market time levels reveal that there is still room for home values to climb in spite of the erosion in home affordability.
The Bottom Line: In considering today’s ultra-low mortgage rate and rising median household income, the monthly payment for the record level median detached sales price is still affordable. There is not enough emphasis on the importance of looking at the monthly payment of a home and the impact on a family’s budget; instead, way too much weight is placed on where prices stand today.
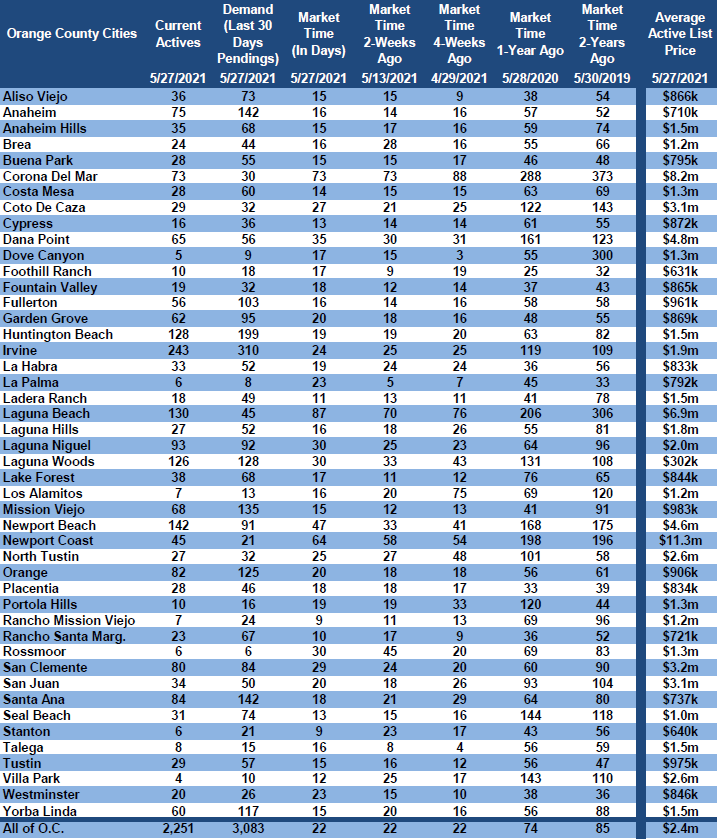
Active Listings
The current active inventory added only 8 homes in the past 2-weeks.
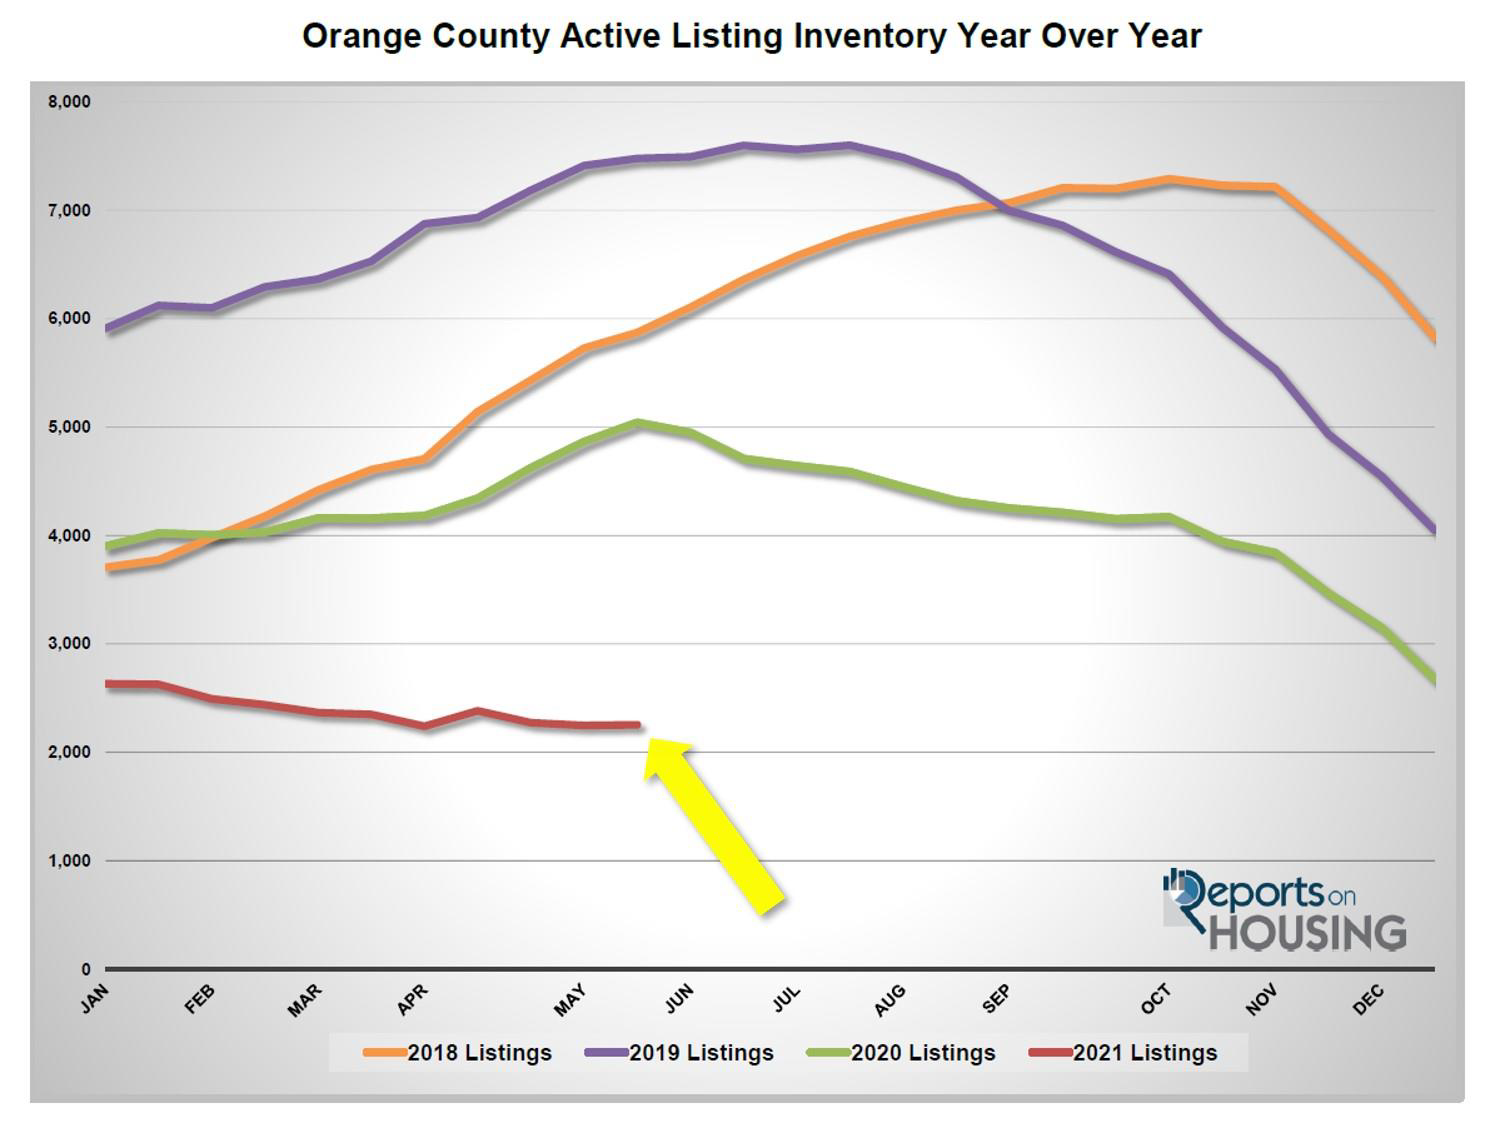
The active listing inventory added 8 homes in the past couple of weeks, nearly unchanged, and now sits at 2,255 homes. With kids getting out of school, summer vacation has arrived and so has the Summer Market for housing. Typically, demand slightly drops with the distractions of summer, which allows the inventory to rise. Yet, housing is far from typical given today’s exceptionally hot levels. That means that the supply of available homes to purchase will not rise enough to get to a much more normal, healthy, sustainable level until mortgage rates start to rise.
Since comparing year over year data in housing is not accurate this year due to COVID-19 skewing the data last year, it is much better to compare current levels to the 5-year average from 2015 to 2019. From May 1st to May 15th, there were 424 fewer new FOR-SALE signs in Orange County, 20% less than the 5-year average. The lack of available replacement homes has many homeowners alarmed about selling. They are fearful that there will be “nothing to buy,” limiting the number willing to participate. This will continue to be an issue until rates rise, which will result in the inventory rising from its ultra-low levels.
Last year at the end of May there were 5,044 homes on the market, 2,789 additional homes, or 124% more. The 5-year average from 2015 to 2019 is 6,363, an extra 4,108 homes, or 182% more. There was an overabundance of choices for buyers compared to today.
Demand
Demand decreased by 1% in the past couple of weeks.
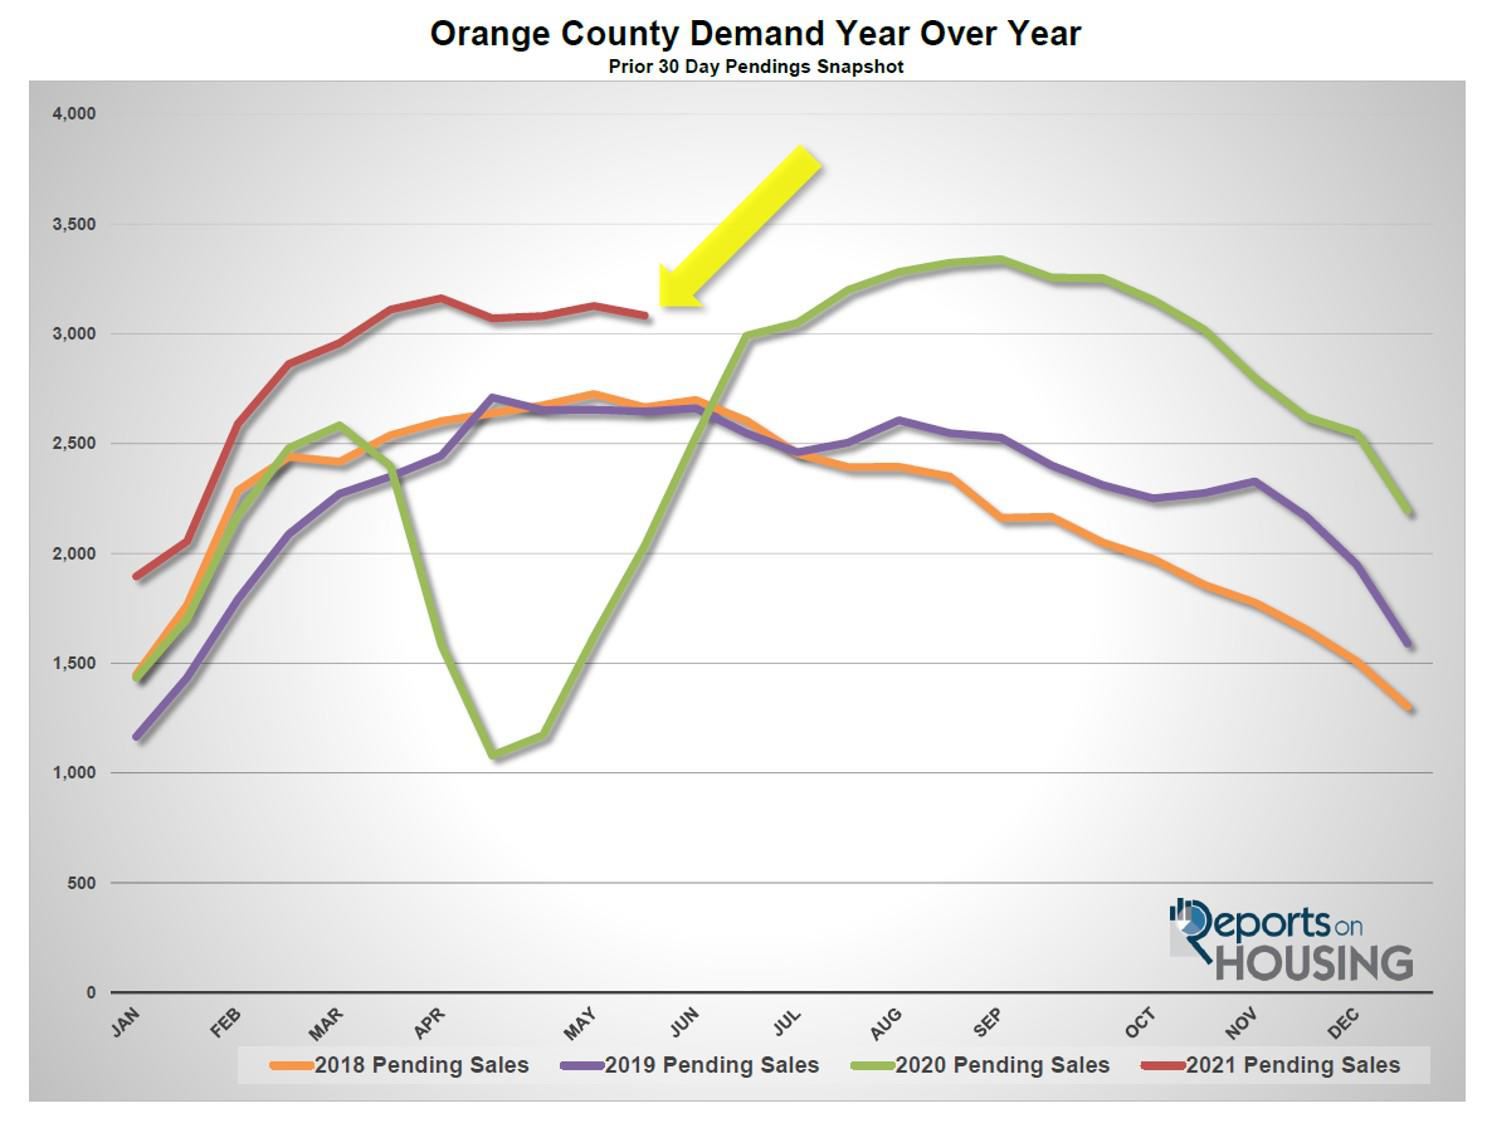
Demand, a snapshot of the number of new pending sales over the prior month, decreased from 3,127 to 3,083 in the past couple of weeks, shedding 44 pending sales, down 1%. Demand readings are red-hot today, yet would be even hotter if more homeowners opted to list their homes FOR-SALE. The trend of fewer homeowners selling will be here to stay until rates rise and homes take a bit longer to sell, allowing for the inventory to climb. Expect demand to drop slightly with the beginning of the Summer Market. Even though today’s market is sizzling hot, the distractions of summer, from the beach to family vacations, will be magnified this year due to coming out of the pandemic, which will slow demand slightly.
Last year, demand was at 2,035 and was swiftly recovering from the depths of the start of the pandemic. The 5-year average for demand from 2015 through 2019, a much better comparison, was at 2,858 pending sales, 225 fewer pending sales, or 7% less.
In the past two-weeks the Expected Market Time (the number of days to sell all Orange County listings at the current buying pace) remained unchanged at 22 days. It has been stuck at 22 days since the end of April. It is a very Hot Seller’s Market (less than 60 days) where there are a ton of showings, sellers get to call the shots during the negotiating process, multiple offers are the norm, and home values are rising rapidly. Last year the Expected Market Time was at 74 days, drastically different than today, but improving rapidly. The 5-year average from 2015 through 2019 was at 67 days, much slower than today, but still a Slight Seller’s Market.
Luxury End
With a sharp drop in demand, the luxury market may have peaked a couple of weeks ago.
In the past two weeks the luxury inventory of homes priced above $1.5 million increased by 3 homes, nearly unchanged, and now sits at 792. At the same time, luxury demand decreased by 28 pending sales, down 5%, and now sits at 497. Demand typically peaks between April and May, and the sharp drop indicates that the peak may have been reached in mid-May. With the inventory nearly unchanged and dropping demand, the overall Expected Market Time for luxury homes priced above $1.5 million increased from 45 to 48 days, its largest increase since the start of the year, yet is still a very Hot Seller’s Market.
Expect the luxury market to continue to slightly cool with all the distractions of summer.
Year over year, luxury demand is up by 296 pending sales, or 147%, and the active luxury listing inventory is down by 605 homes, or 43%. The Expected Market Time last year was at 209 days, but was dropping like a rock as housing began to rev its massive economic engine. Year over year statistics for luxury will be much more comparable starting in July.
For homes priced between $1.5 million and $2 million, the Expected Market Time increased from 22 to 28 days. For homes priced between $2 million and $4 million, the Expected Market Time remained unchanged at 41 days. For homes priced above $4 million, the Expected Market Time increased from 114 to 126 days. At 126 days, a seller would be looking at placing their home into escrow around October 2021.
Orange County Housing Summary
• The active listing inventory added 8 homes in the past two-weeks, nearly unchanged, and now totals 2,255. From May 1st to May 15th, there were 20% fewer homes that came on the market compared to 5-year average between 2015 to 2019 (2020 was skewed do to COVID-19), 424 less. Last year, there were 5,044 homes on the market, 2,789 additional homes, or 123% more.
• Demand, the number of pending sales over the prior month, decreased by 44 pending sales in the past two-weeks, down 1%, and now totals 3,083. Rates remain below 3%, maintaining demand’s current brisk pace. Last year, there were 2,035 pending sales, 34% fewer than today. Keep in mind, housing was thawing out rapidly in May and June as rates dropped to historically low levels.
• The Expected Market Time, the number of days to sell all Orange County listings at the current buying pace, remained unchanged at 22 days in the past couple of weeks, an extremely Hot Seller’s Market (less than 60 days). It was at 74 days last year, slower than today.
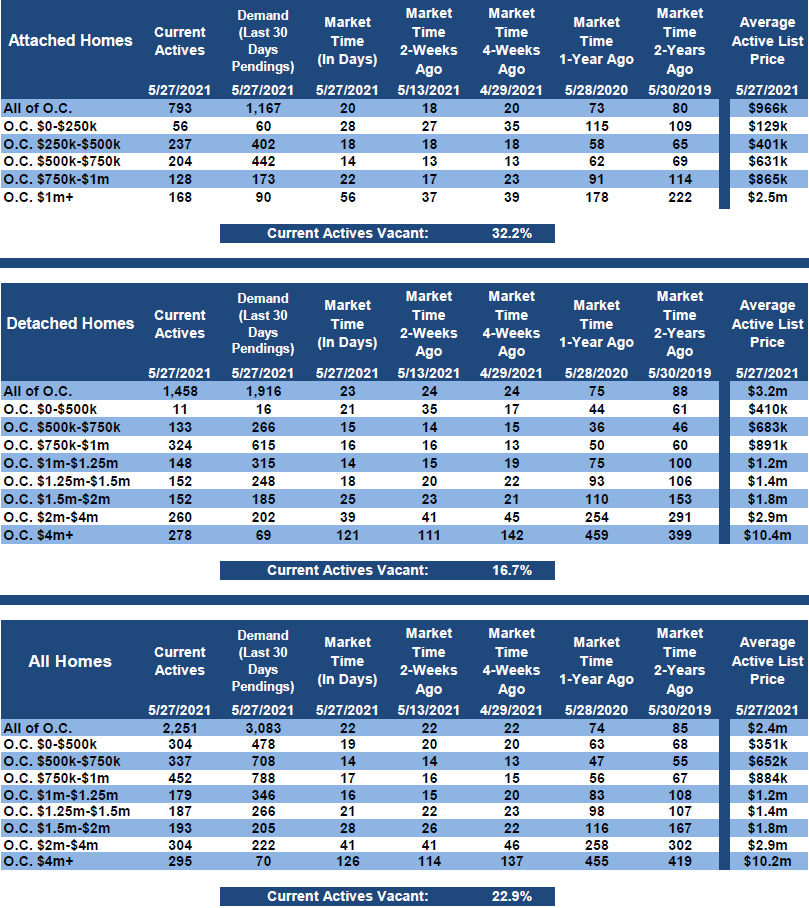
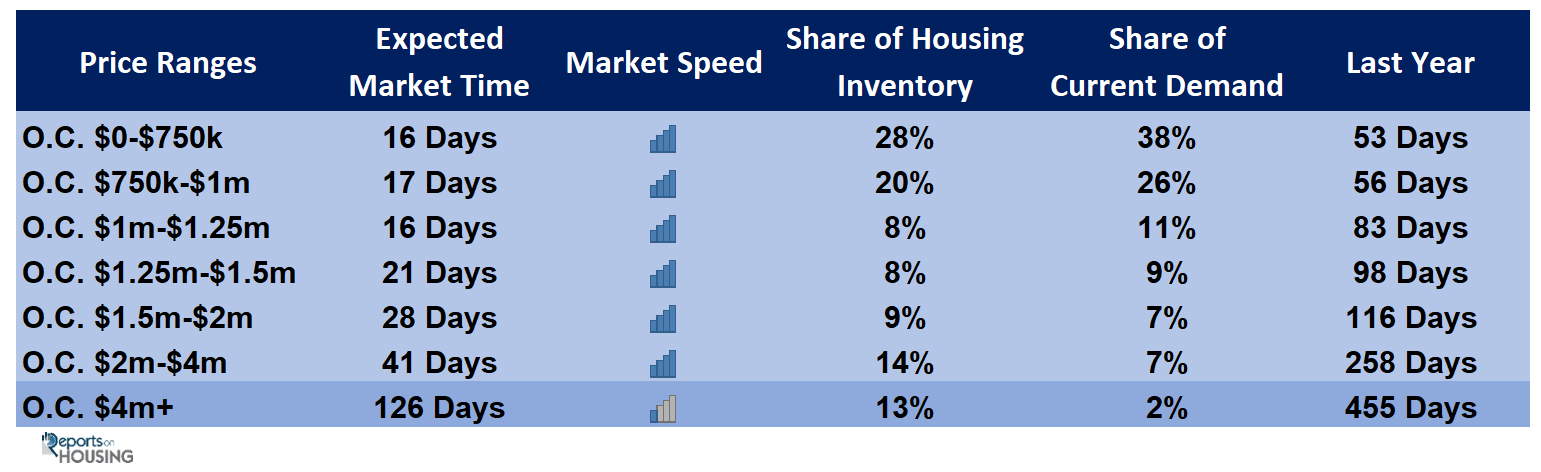
• For homes priced below $750,000, the market is a Hot Seller’s Market (less than 60 days) with an Expected Market Time of 16 days. This range represents 28% of the active inventory and 38% of demand.
• For homes priced between $750,000 and $1 million, the Expected Market Time is 17 days, a Hot Seller’s Market. This range represents 20% of the active inventory and 26% of demand.
• For homes priced between $1 million to $1.25 million, the Expected Market Time is 16 days, a Hot Seller’s Market.
• For homes priced between $1.25 million to $1.5 million, the Expected Market Time is 21 days, a Hot Seller’s Market.
• For homes priced between $1.5 million and $2 million, the Expected Market Time increased from 22 to 28 days.
For homes priced between $2 million and $4 million, the Expected Market Time remained unchanged at 41 days.
For homes priced above $4 million, the Expected Market Time increased from 114 to 126 days.
• The luxury end, all homes above $1.5 million, accounts for 36% of the inventory and 16% of demand.
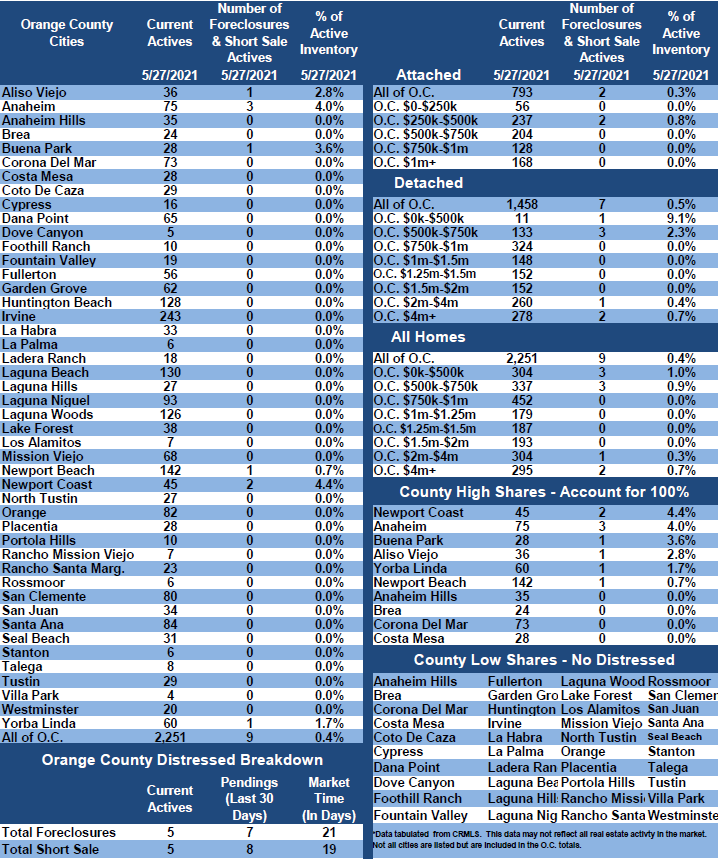
• Distressed homes, both short sales and foreclosures combined, made up only 0.4% of all listings and 0.5% of demand. There are only 5 foreclosures and 5 short sales available to purchase today in all of Orange County, 10 total distressed homes on the active market, down 4 from two-weeks ago. Last year there were 39 total distressed homes on the market, more than today.
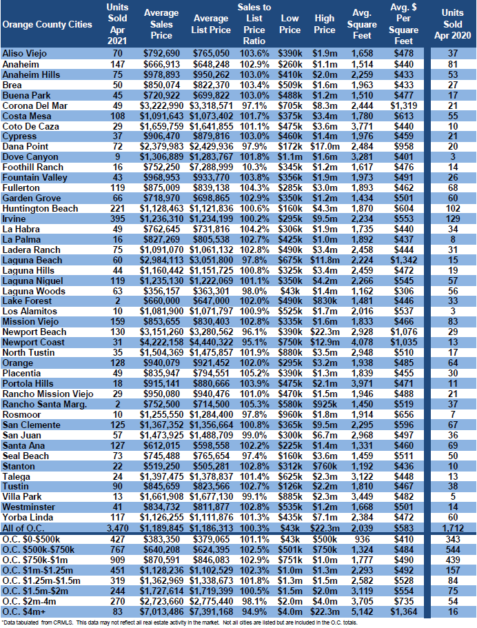
• There were 3,470 closed residential resales in April, 103% more than April 2020’s 1,712 closed sales. March marked an 8% rise over March 2021. It was the strongest closing month since 2005. The sales to list price ratio was 100.3% for all of Orange County. Foreclosures accounted for just 0.1% of all closed sales, and short sales accounted for 0.1%. That means that 99.8% of all sales were good ol’ fashioned sellers with equity.
Have a great week.
Sincerely,
Steven Thomas
Quantitative Economics and Decision Sciences
Cell: (949) 874-8221
Copyright 2021- Steven Thomas, Reports On Housing – All Rights Reserved. This report may not be reproduced in whole or part without express written permission by author.