Crash Coming?

May 17, 2021
With housing values soaring like they did prior to the Great
Recession coupled with recent inflation news, many are
calling for a correction in housing.
No Crash Coming
Housing data illustrates that there is not a housing crash on the horizon.
Home prices were surging from 2000 through 2006. Homeowners were sitting back in their recliners watching their home value skyrocket to the heavens. It seemed like the housing market was unstoppable. Then it all came tumbling down with the beginning of the subprime meltdown in March 2007. Values dropped like a rock. Many lost their homes to foreclosure or short sale. Everybody remembers the scars of the Great Recession. Either they were directly affected, or it happened to somebody they knew.
Once again, housing is soaring upward with seemingly no end in sight. Buyers are tripping over each other, willing to pay tens of thousands of dollars above the asking price. Throw in the news of rising inflation and the potential of drastically higher mortgage rates, the madness must come to a screeching halt soon, right? Even though so many are anticipating and reporting that a housing crash is eminent, it simply is not going to occur, not now, not in the next 6-months, and not in the foreseeable future.
The Great Recession was triggered by the housing market where anyone could purchase a home regardless of their true qualifications. Zero down payment loans, negative ARM’s, cash out refinancing, subprime lending, and fudged loan documents all contributed to the astonishing rise in values that inflated the housing bubble that ultimately collapsed in 2007. The housing market crashed, and home values plunged.
What occurred can be explained by looking at supply and demand. When supply rises and demand drops, the market time for housing climbs. When supply drops and demand rises, the market time falls. The writing was already on the wall a couple of years prior to the start of the Great Recession. Housing data illustrated market conditions that were lining up in favor of buyers. The inventory swelled while demand crumbled. As a result, the Expected Market Time (the time between hammering in the FOR-SALE sign to opening escrow) rose to unfathomable heights. In June 2006, the Expected Market Time surpassed 150 days, a Deep Buyer’s Market. It grew to 225 days by year’s end. In 2007, it surpassed 150 days in March, the start of the subprime meltdown, and by July, surpassed 290 days. By year’s end, it reached 451 days.
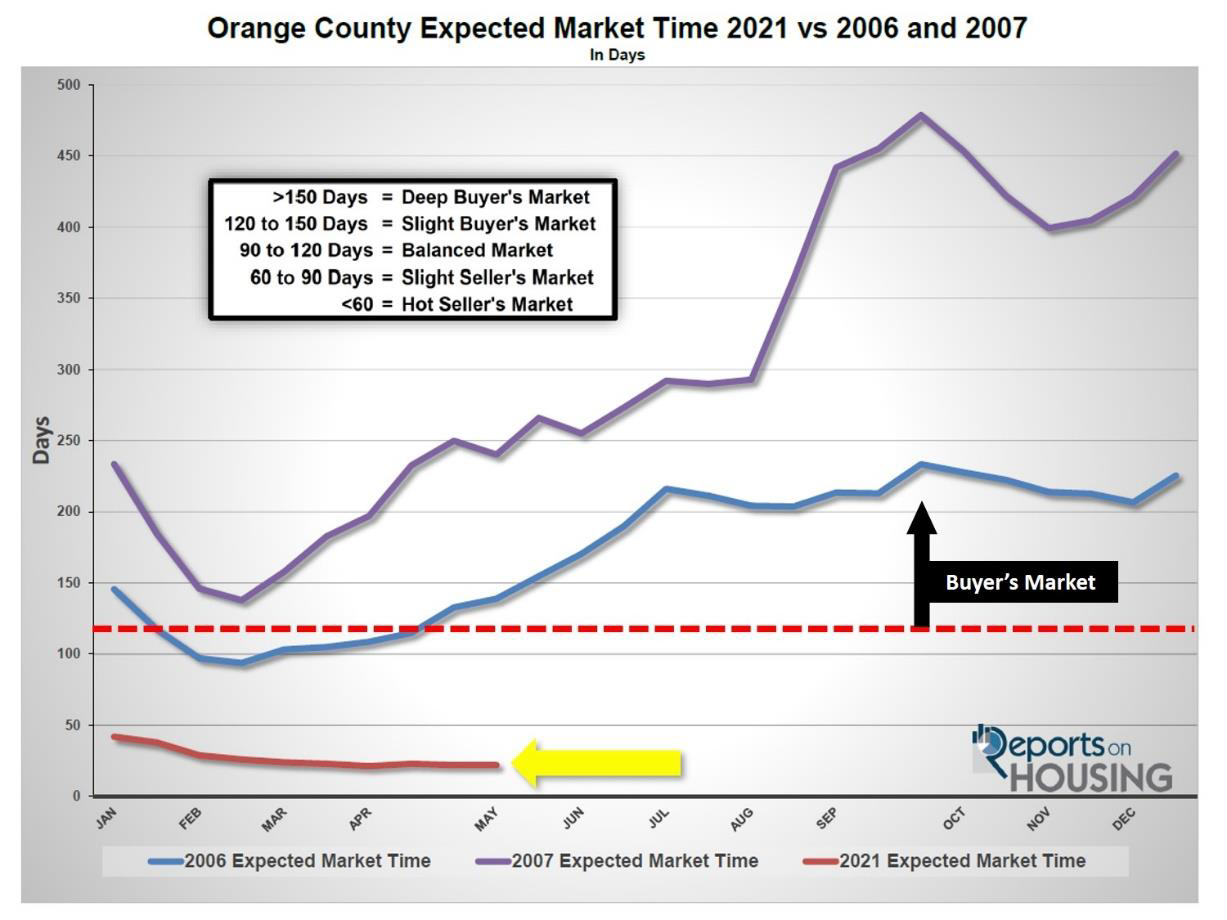
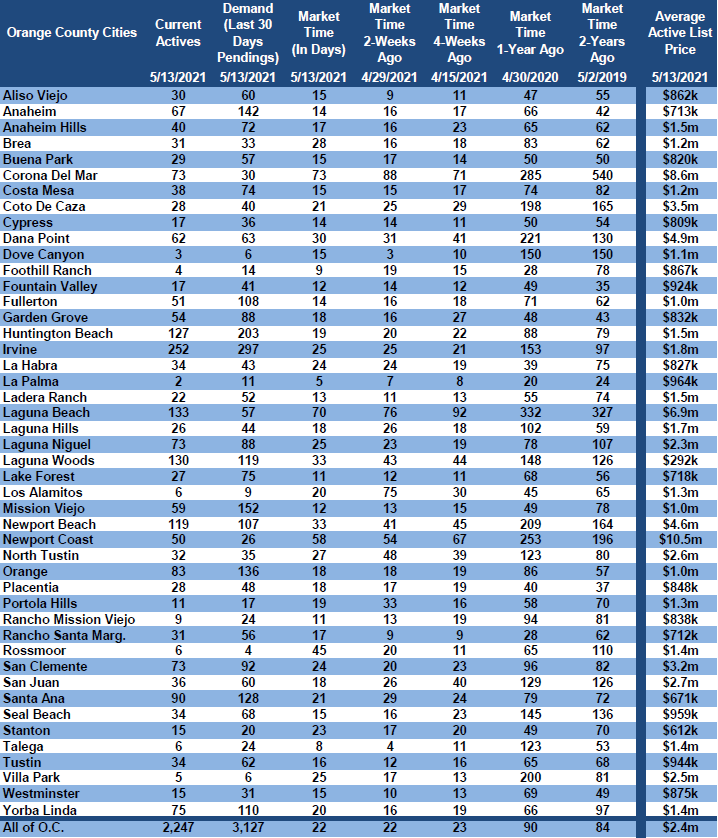
Contrast that to today and the landscape is entirely different. The inventory is at unprecedented record low levels and demand, fueled by historically low rates below 3%, is off the charts. Today’s Expected Market Time in Orange County is at 22 days, an extremely crazy, nutty, Hot Seller’s Market (below 60-days), where home values are surging higher every month, sellers get to call the shots, and most home sales are closing well above their asking prices. It will remain a Hot Seller’s Market for the remainder of the year based on the anemic inventory and today’s crazy demand.
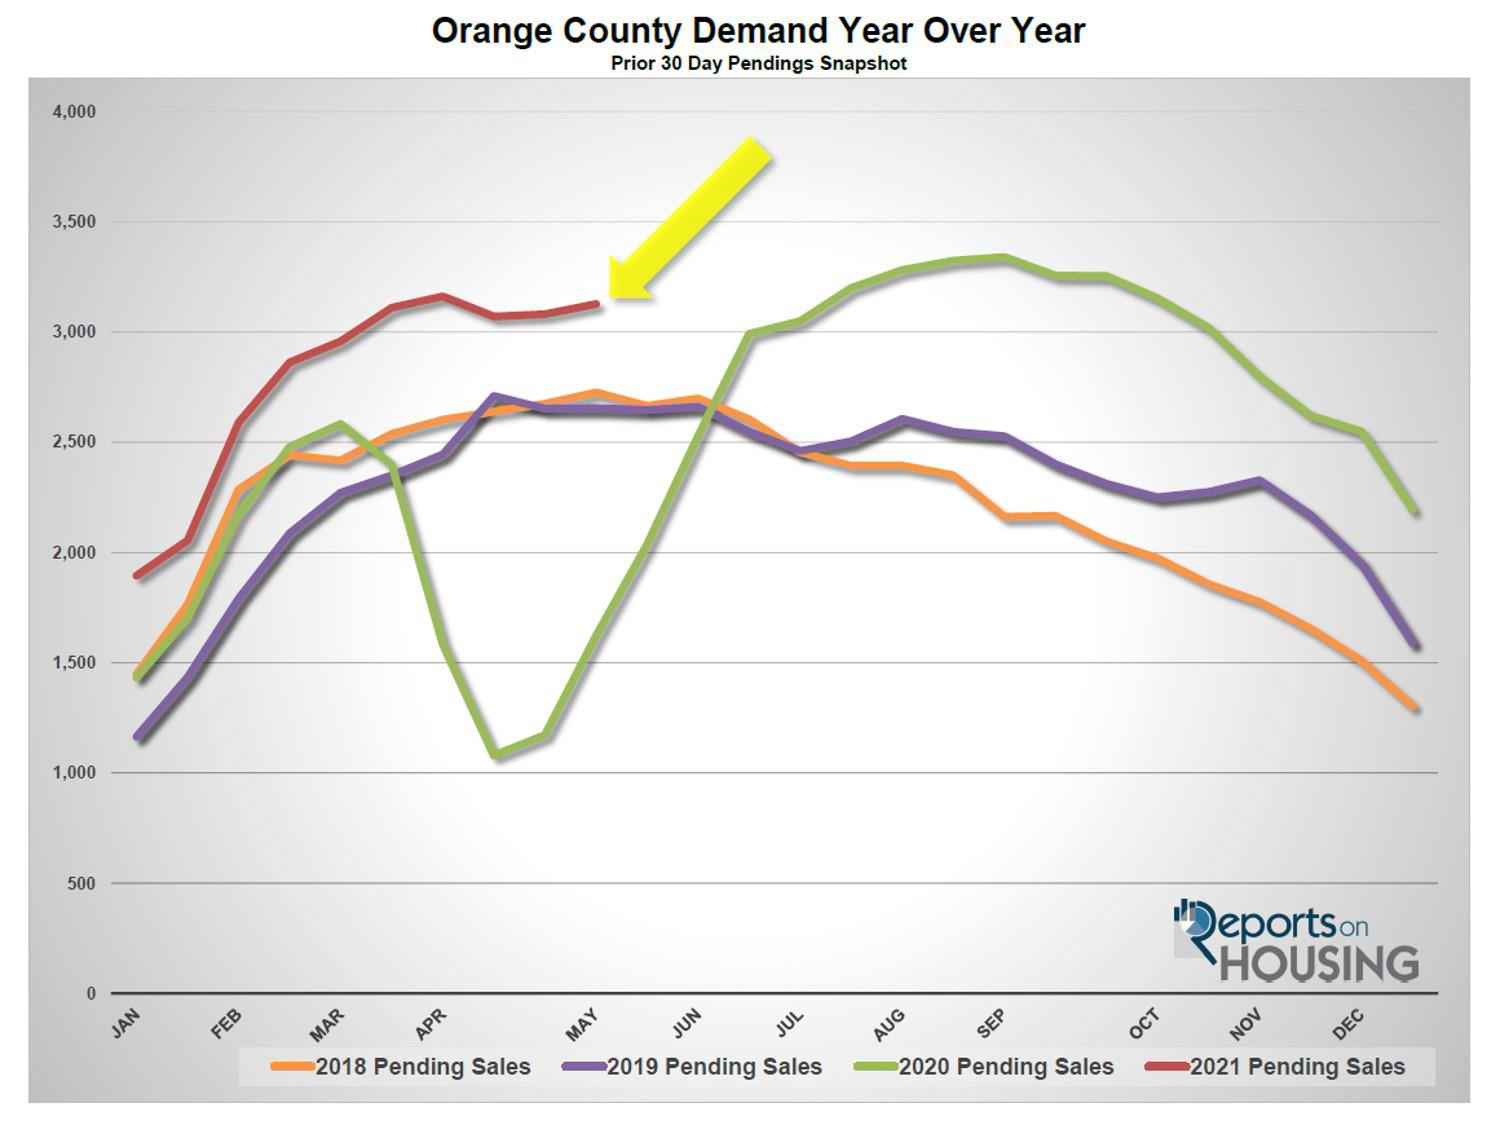
The big difference is supply and demand. Currently, the active listing inventory is at 2,247 homes. Back in October 2006, there were over 15,000 homes. In 2007, there were over 17,000 homes, over six times today’s supply. Current demand (the last 30 days of new escrows) is at 3,127. In 2006, it averaged 2,325 pending sales, and 2007 averaged 1,713. With an enormous supply and weak demand, the Expected Market Time reached very high levels prior to the Great Recession, a precursor to the massive slide in home values.
There are some naysayers who are calling for a massive spike in mortgage rates due to inflation. Last week’s Consumer Price Index appeared to be soaring out of control with a 4.2% increase over last year. Yet, in taking a closer look at the numbers, the Federal Reserve is correct in their anticipation of “transitory,” or short-lived, inflation. The rise had more to do with short-term supply chain problems in lumber and a global chip shortage. Used cars jumped 10% as car rental companies clamored to restock their depleted inventories. Sporting event prices surged 10.1%, airline tickets climbed 10.2%, and hotel rooms were up by 8.8%. These were all discounted prior because of the pandemic. All other goods were unchanged. As a result, mortgage rates have not moved and remain just below 3%.
Mortgage rates are forecasted to rise to about 3.5% by year’s end due to an improving economy that is emerging from the pandemic. The rise will not dismantle the housing market; instead, it will decelerate the market from an insanely Hot Seller’s Market with an Expected Market Time of 22 days, to a regular Hot Seller’s Market with a market time above 40 days.
The Bottom Line: The housing market is NOT going to crash. The inventory is low, demand is high, market time is at all-time lows, mortgage rates are at record low levels, buyers must qualify for mortgages, subprime and zero-down loans are not fueling housing, and homeowners have plenty of equity.
Active Listings
The current active inventory dropped by 1% in the past couple of weeks to its second lowest level since tracking.
The active listing inventory shed 27 homes in the past couple of weeks, down 1%, and now sits at 2,247 homes, 7 more homes than the lowest level ever since tracking began in 2004 achieved at the start of April at 2,240. Record low rates have instigated today’s scorching demand, which has made it extremely difficult for the inventory to rise from its current anemic, record low levels. Also, a lack of homes coming on the market has contributed heavily towards the supply crisis. Do not expect the inventory to rise much until rates finally climb.
Since comparing year over year data in housing is not accurate this year due to COVID-19 skewing the data last year, it is much better to compare current levels to the 5-year average from 2015 to 2019. In April, there were 516 fewer new FOR-SALE signs in Orange County, 13% less than that 5-year average. The lack of available replacement homes has many homeowners alarmed about selling. They are fearful that there will be “nothing to buy,” limiting the number willing to participate. Also, while home values are soaring, many homeowners want to sit back and wait for their homes to continue to rapidly appreciate before cashing in on the market.
Last year in mid-May there were 4,867 homes on the market, 2,620 additional homes, or 117% more. The 5-year average from 2015 to 2019 is 6,172, an extra 3,925 homes, or 175% more. There were a lot more choices for buyers compared to today.

Demand
Demand increased by 1% in the past couple of weeks.
Demand, a snapshot of the number of new pending sales over the prior month, increased from 3,081 to 3,127 in the past couple of weeks, adding 46 pending sales, up 1%. According to Freddie Mac’s Primary Mortgage Market Survey®, rates have dropped down to 2.94% as of May 13th, further fueling this crazy market. Since April 1st, rates have dropped nearly a quarter percent. Demand will most likely peak for the year sometime this month as it typically does during the Spring Market. It will remain elevated due to the incredible velocity of the market, but it will slightly downshift as housing transitions to the Summer Market. The distractions of summer, from the beach to family vacations, will be magnified this year due to coming out of the pandemic.
Last year, demand was at 1,622, starting its V-shaped recovery after hitting the lowest point since the Great Recession due to the start of the pandemic. The 5-year average for demand from 2015 through 2019, a much better comparison, was at 2,915 pending sales, 212 fewer pending sales, or 7% less.
In the past two-weeks the Expected Market Time (the number of days to sell all Orange County listings at the current buying pace) remained unchanged at 22 days. It is a very Hot Seller’s Market (less than 60 days) where there are a ton of showings, sellers get to call the shots during the negotiating process, multiple offers are the norm, and home values are rising rapidly. Last year the Expected Market Time was at 90 days, drastically different than today. The 5-year average from 2015 through 2019 was at 64 days, much slower than today, but still a Slight Seller’s Market.
Luxury End
The luxury market inventory dropped in the past couple of weeks.
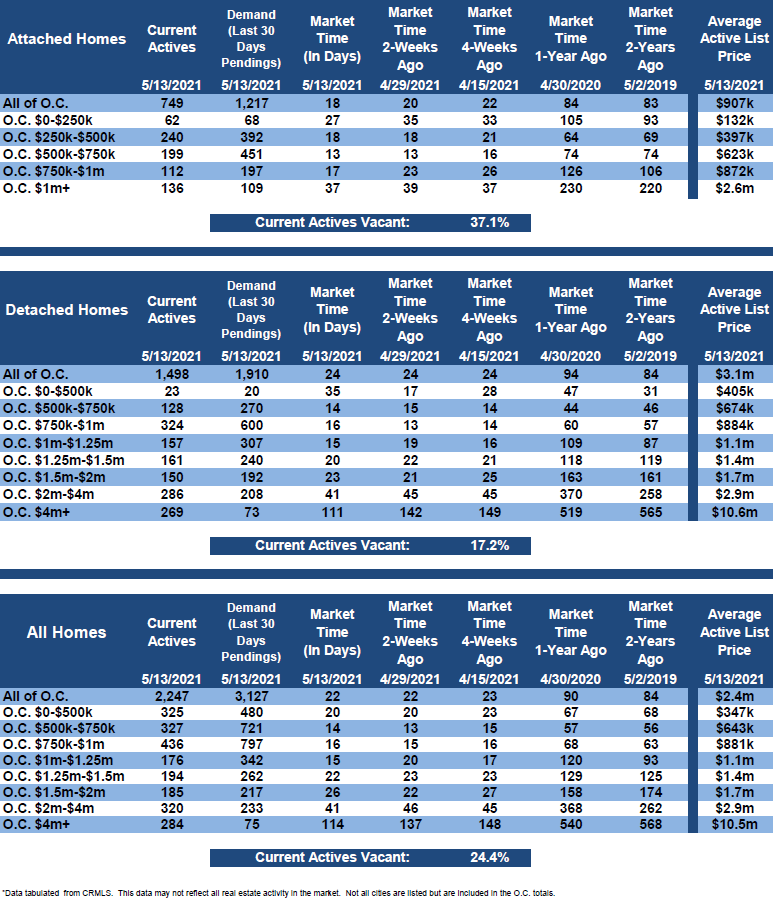
In the past two weeks the luxury inventory of homes priced above $1.5 million decreased by 37 homes, down 4%, and now sits at 789, the lowest level in years. At the same time, luxury demand decreased by 2 pending sales, nearly unchanged, and now sits at 525. With the inventory dropping while demand remains elevated, the overall Expected Market Time for luxury homes priced above $1.5 million decreased from 47 to 45 days, its strongest level on record and is technically a Hot Seller’s Market.
Expect the luxury market to continue to improve until peaking sometime this month. It may have peaked a couple of weeks ago.
Year over year, luxury demand is up by 385 pending sales, or 275%, and the active luxury listing inventory is down by 523 homes, or 40%. The Expected Market Time last year was at 281 days, substantially slower than today amidst the backdrop of the start of the pandemic. Year over year statistics for luxury will be much more comparable starting in July.
For homes priced between $1.5 million and $2 million, the Expected Market Time remained unchanged at 22 days. For homes priced between $2 million and $4 million, the Expected Market Time decreased from 46 to 41 days. For homes priced above $4 million, the Expected Market Time decreased from 137 to 114 days. At 114 days, a seller would be looking at placing their home into escrow around September 2021.
Orange County Housing Summary
• The active listing inventory decreased by 27 homes in the past two-weeks, down 1%, and now totals 2,247, its second lowest level since tracking began in 2004 behind 2,240 achieved on April 1st. In April, there were 13% fewer homes that came on the market compared to 5-year average between 2015 to 2019 (2020 was skewed do to COVID-19), 516 less. Last year, there were 4,867 homes on the market, 2,620 additional homes, or 117% more.
• Demand, the number of pending sales over the prior month, increased by 46 pending sales in the past two-weeks, up 1%, and now totals 3,127. Rates remain below 3%, maintaining demand’s current brisk pace. Last year, there were 1,622 pending sales, 48% fewer than today. Keep in mind, it was the start of the pandemic too, which negatively affected demand through the end of May.
• The Expected Market Time, the number of days to sell all Orange County listings at the current buying pace, remained unchanged at 22 days in the past couple of weeks, an extremely Hot Seller’s Market (less than 60 days). It was at 90 days last year, slower than today.
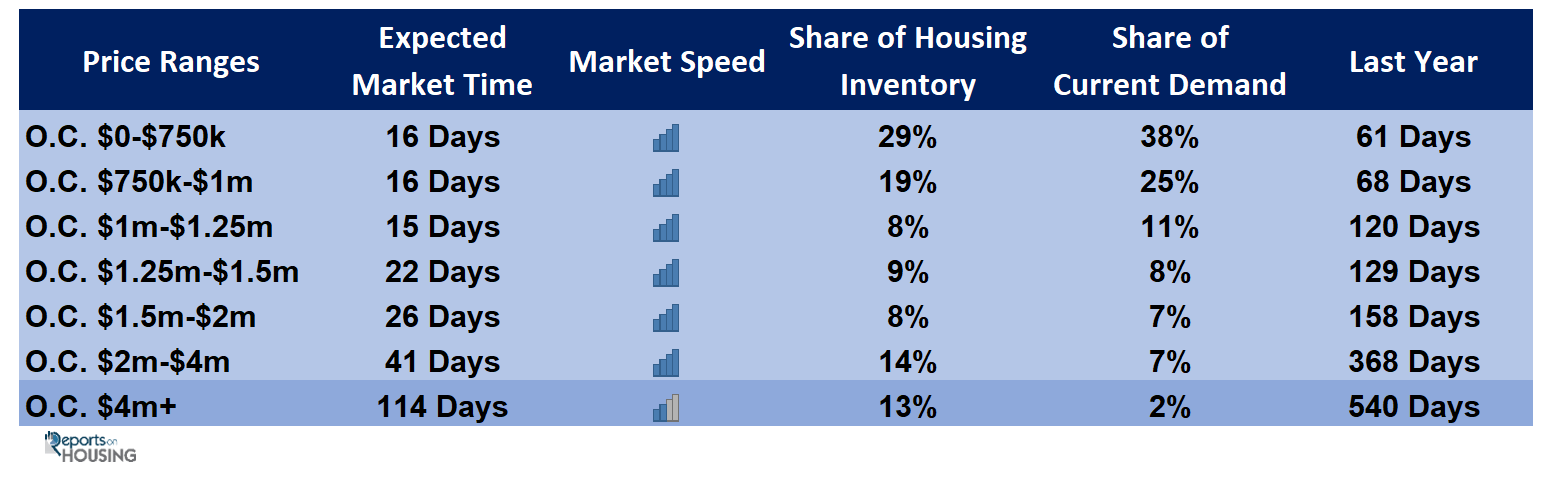
• For homes priced below $750,000, the market is a Hot Seller’s Market (less than 60 days) with an Expected Market Time of 16 days. This range represents 29% of the active inventory and 38% of demand.
• For homes priced between $750,000 and $1 million, the Expected Market Time is 16 days, a Hot Seller’s Market. This range represents 19% of the active inventory and 25% of demand.
• For homes priced between $1 million to $1.25 million, the Expected Market Time is 15 days, a Hot Seller’s Market.
• For homes priced between $1.25 million to $1.5 million, the Expected Market Time is 22 days, a Hot Seller’s Market.
• For homes priced between $1.5 million and $2 million, the Expected Market Time remained unchanged at 22 days. For homes priced between $2 million and $4 million, the Expected Market Time decreased from 46 to 41 days. For homes priced above $4 million, the Expected Market Time decreased from 137 to 114 days.
• The luxury end, all homes above $1.5 million, accounts for 35% of the inventory and 16% of demand.
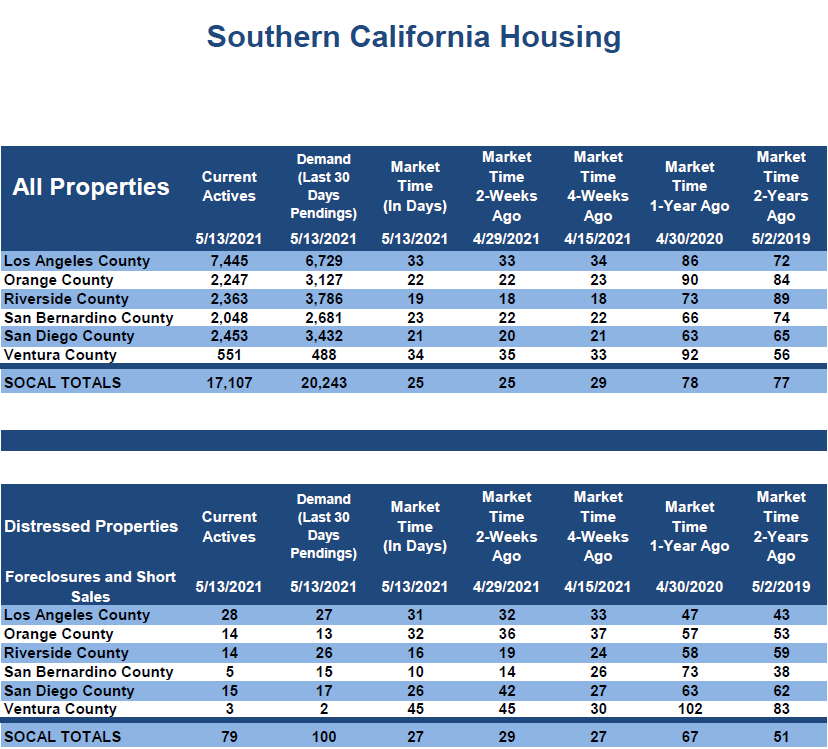
• Distressed homes, both short sales and foreclosures combined, made up only 0.6% of all listings and 0.4% of demand. There are only 9 foreclosures and 5 short sales available to purchase today in all of Orange County, 14 total distressed homes on the active market, up 2 from two-weeks ago. Last year there were 42 total distressed homes on the market, more than today.
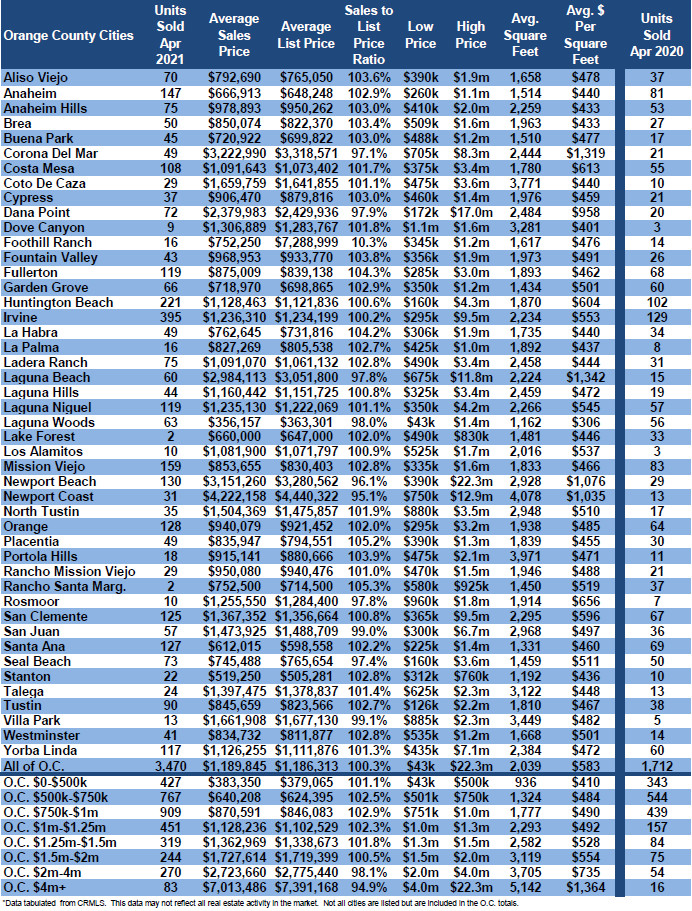
• There were 3,470 closed residential resales in April, 103% more than April 2020’s 1,712 closed sales. March marked an 8% rise over March 2021. It was the strongest closing month since 2005. The sales to list price ratio was 100.3% for all of Orange County. Foreclosures accounted for just 0.1% of all closed sales, and short sales accounted for 0.1%. That means that 99.8% of all sales were good ol’ fashioned sellers with equity.
Have a great week.
Sincerely,
Steven Thomas
Quantitative Economics and Decision Sciences
Cell 949.874.8221
Copyright 2021- Steven Thomas, Reports On Housing – All Rights Reserved. This report may not be reproduced in whole or part without express written permission by author.