
April 14, 2022
EVEN THOUGH HOUSING IS INSANELY HOT, TRENDS HAVE EMERGED
THAT CONFIRM THAT THE ORANGE COUNTY HOUSING MARKET IS
STARTING TO COOL.

Incredible, relaxing, memory-filled vacations come to an end. Ski seasons come to an end. The last pages of a good book come to an end. Binge watching a favorite television show comes to an end. Weekends come to an end. Seemingly nothing lasts forever. For the Orange County housing market, the incredible, insanely Hot Seller’s Market will eventually evolve into something completely different, and that is beginning to take place right now.
Now that the first quarter of 2022 is in the rearview mirror, noticeable cracks have appeared that illustrate a cooling market. It is not as if housing has suddenly tilted in favor of buyers. No, multiple offers are still the norm, and most homes are flying off the market and into escrow just moments after FOR-SALE signs are pounded into the front yard. Buyers are still frustrated by the lack of available homes to purchase in all price ranges. Sellers remain in the driver’s seat able to call the shots. Nonetheless, trends have surfaced that highlight a cooling marketplace that will eventually pave way to a completely different housing scene thanks to a dramatic rise in mortgage rates from 3.25% at the start of the year to 5.25% today (Mortgage News Daily).
CRACK – The current active inventory has increased by 60% since mid-January. From January 20th through today, the number of available homes to purchase has risen from 1,080 to 1,732, up an astonishing 60%, or 652 additional homes. The inventory has struggled to grow since 2020, the start of the pandemic. It is the largest gain since 2019. Today’s level is still extremely anemic and far below normal levels, yet is a trend that demonstrates that not all homes are selling instantly. It will not be long before there are more homes on the market this year compared to 2021. Last year everything that was placed on the market was slammed into escrow. That is not the case today even with a muted number of homes coming on the market.

CRACK – Other than COVID-19 lockdowns of 2020, demand is at its lowest level for this time of the year since 2007 and is already trending lower. Demand, a snapshot of the number of new escrows over the prior month, has been muted since the start of the year and has stalled within the past several weeks. Today’s demand is at 2,241 pending sales, down 27% compared to last year. The 3-year average demand reading prior to COVID (2017 to 2019) for this time of year was at 2,777 pending sales, 24% more than today. Demand readings have been muted by a lack of available homes and fewer homes coming on the market; yet, demand is still falling while the inventory is climbing. Typically, during the Spring Market, pending sales activity is firing on all cylinders, the busiest time of the year, and continues to climb until peaking between the end of April to the middle of May. Demand most likely already peaked at the end of March. It has not been this low in mid-April (ignoring the lockdowns of April 2020 that only initially impacted demand) since 2007 when it measured only 1,910 pending sales.

CRACK – A staggering 15% of all available homes to purchase today reduced their asking price. The Multiple Listing Service (MLS) has a helpful red arrow pointing downward adjacent to the asking price if the asking price was reduced. There are a lot more red arrows pointing down, which last occurred in 2019 when there were over 6,000 homes available. This phenomenon is indicative of a market where buyers are quickly becoming less interested in overpriced homes. Many sellers are arbitrarily pricing and stretching the asking price in anticipation of selling for much higher than the most recent pending or comparable sell. While this strategy may have worked over the past couple of years, buyers will become less willing to stretch in price as the year progresses. Many sellers will have to reduce their asking price to find success, and, in many cases, more than once.
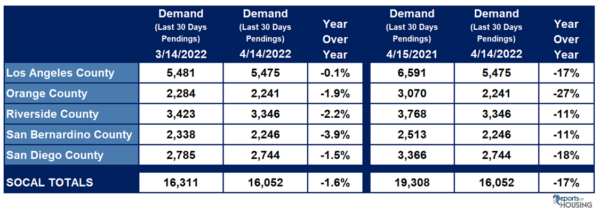
CRACK – Like Orange County, all counties in Southern California are experiencing stalled demand along with enormous drops in year-over-year readings. It appears as if demand has stalled for all markets, peaking between mid-March to the end of March. Demand typically peaks between the end of April to the end of May, but soaring mortgage rates has pulled that peak forward and demand has stalled. All Southern California markets are experiencing recent drops

in demand at a time when it is normally rising. The 3-year average rise in SoCal demand (2017 to 2019) from mid-March to mid-April was 8% compared to Southern California’s 1.6% drop. Year-over-year drops are staggering as well, off by 17% throughout the region. The bottom line: the trend of a cooling market is not just isolated to Orange County. It is affecting all Southern California.
While there are definite cracks in Orange County’s pandemic induced housing run, the market is still an insanely Hot Seller’s market. Due to an unprecedented spike in mortgage rates, new trends are emerging fast. These trends should be seen as cautionary flags in approaching the local housing market. Carefully pricing is rapidly becoming an essential ingredient to successfully selling. As these trends continue, if higher rates persist with duration, the market will only cool further. The housing market will not change overnight; it will evolve over time. This year still promises to be an excellent year for sellers, only a bit more challenging, necessitating a more cautious, deliberate strategy and approach to the housing market.
Active Listings
The current active inventory surged higher in the past couple of weeks.
The active listing inventory added 180 homes in the past couple of weeks, up 12%, and now sits at 1,732 homes, still its lowest level for this time of year since tracking began in 2004. Yet, this is the first year since 2019 that the inventory is methodically rising. With a major spike in mortgage rates, demand has cooled. Homes that are priced well and in good condition will fly off the market. Homes that are overpriced, in poor condition, or have an inferior location will accumulate on the market allowing the active inventory to continue to grow. There are more OPEN HOUSE directional arrows at intersections, another barometer indicating that homes are beginning to take a bit longer to sell. Expect the inventory to continue to surge upward. Normally it peaks during the summer months, prior to the kids going back to school. But, due to higher mortgage rates, anticipate a delayed peak that occurs between October and November as many homes sit without success.
Last year, the inventory was at 2,384, 38% higher, or an additional 652 homes. The biggest complaint last year was that there were not enough homes on the market, yet there were more homes available compared to today. The 3-year average prior to COVID (2017 through 2019) is 5,780, an extra 4,048 homes, or 234% more, more than triple today. There were a lot more choices back then, though this is slowly changing.
For the first couple of weeks of April, there were 1,563 new FOR-SALE signs in Orange County, 476 fewer than the 3-year average from 2017 to 2019, 23% less. Every single missing sign counters the potential rise in the inventory due to higher mortgage rates.
Demand
Demand uncharacteristically dropped in the past couple of weeks.
Demand, a snapshot of the number of new escrows over the prior month, decreased from 2,286 to 2,241 in the past couple of weeks, down 45 pending sales, or 2%. It was the first drop of the year at a time when it typically rises by 4% (pre-COVID average between 2017 to 2019). It appears as if demand may have reached a premature peak a couple of weeks ago. Normally demand peaks between the end of April to the end of May. Current demand is muted due to a major spike in mortgage rates, increasing from 3.25% in January to 5.25% today according to Mortgage News Daily. Affordability has eroded tremendously since ringing in a New Year, sidelining many buyers. Buyers will be a bit stingier on price going forward, not as willing to stretch much above recent comparable pending and closed sales, especially as the year progresses. Expect demand to remain muted and slightly fall from now through summer months.
Last year, demand was at 3,070, 37% more than today, or an extra 829. The 3-year average prior to COVID (2017 to 2019) was at 2,777 pending sales, 24% more than today. In Orange County, current demand readings have been muted by a lack of available homes and not enough coming on the market.
With the supply surging higher and demand dropping, the Expected Market Time (the number of days to sell all Orange County listings at the current buying pace) decreased from 20 to 23 days. At 23 days it remains an insane, Hot Seller’s Market (less than 60 days) where there are a ton of showings, sellers get to call the shots during the negotiating process, multiple offers are the norm, and home values are rising rapidly. Last year the Expected Market Time was at 23 days, identical to today. The 3-year average prior to COVID was at 62 days, substantially slower than today and a Slight Seller’s Market (between 60 and 90 days).
Luxury End
The luxury market cooled a bit with a surge in the luxury inventory in the past couple of weeks.
In the past couple of weeks, the luxury inventory of homes priced above $2 million increased from 448 to 478 homes, up 7%, or an additional 30 homes, its highest level since October. It has increased by 14% over the past four weeks. Luxury demand increased by 2 pending sales, up 1%, and now sits at 255. With the supply surging compared to a slight increase in demand, the overall Expected Market Time for luxury homes priced above $2 million increased from 53 to 56 days, still an extremely hot market for luxury.
Year over year, luxury demand is down by 55 pending sales or 18%, and the active luxury listing inventory is down by 204 homes or 30%. The Expected Market Time last year was at 66 days, exceptionally hot for luxury, but slower than today, indicating just how unbelievably hot the luxury market is right now.
For homes priced between $2 million and $4 million, the Expected Market Time in the past two weeks increased from 34 to 40 days. For homes priced between $4 million and $8 million, the Expected Market Time decreased from 91 to 84 days. For homes priced above $8 million, the Expected Market Time decreased from 267 to 157 days. At 157 days, a seller would be looking at placing their home into escrow around September 2022.
Orange County Housing Summary
- The active listing inventory surged higher by 180 homes, up 12%, and now totals 1,732 homes, still its lowest level for this time of the year since tracking began 18 years ago. In the first couple of weeks of April, there were 23% fewer homes that came on the market compared to the 3-year average prior to COVID (2017 to 2019), 476 fewer. Last year, there were 2,384 homes on the market, 652 additional homes, or 38% more.
- Demand, the number of pending sales over the prior month, decreased by 45 pending sales in the past two weeks, down 2%, and now totals 2,241, its first drop of the year. Last year, there were 3,070 pending sales, 37% more than today. The 3-year average prior to COVID (2017 to 2019) was 2,777, or 24% more.
- With supply surging higher and demand dropping, the Expected Market Time, the number of days to sell all Orange County listings at the current buying pace, increased from 20 to 23 days in the past couple of weeks, still an insanely Hot Seller’s Market (less than 60 days). It was at 23 days last year, identical to today.
- For homes priced below $750,000, the market is a Hot Seller’s Market (less than 60 days) with an Expected Market Time of 17 days. This range represents 19% of the active inventory and 27% of demand.
- For homes priced between $750,000 and $1 million, the Expected Market Time is 18 days, a Hot Seller’s Market. This range represents 21% of the active inventory and 27% of demand.
- For homes priced between $1 million to $1.25 million, the Expected Market Time is 19 days, a Hot Seller’s Market. This range represents 11% of the active inventory and 14% of demand.
- For homes priced between $1.25 million to $1.5 million, the Expected Market Time is 21 days, a Hot Seller’s Market. This range represents 10% of the active inventory and 11% of demand.
- For homes priced between $1.5 million to $2 million, the Expected Market Time is 25 days, a Hot Seller’s Market. This range represents 11% of the active inventory and 10% of demand.
- For homes priced between $2 million and $4 million, the Expected Market Time in the past two weeks increased from 34 to 40 days. For homes priced between $4 million and $8 million, the Expected Market Time decreased from 91 to 84 days. For homes priced above $8 million, the Expected Market Time decreased from 267 to 157 days.
- The luxury end, all homes above $2 million, accounts for 28% of the inventory and 11% of demand.
- Distressed homes, both short sales and foreclosures combined, made up only 0.1% of all listings and 0.2% of demand. There is only 1 foreclosure and no short sales available to purchase today in all of Orange County, 1 total distressed home on the active market, down 2 from two weeks ago. Last year there were 11 total distressed homes on the market, similar to today.
- There were 2,645 closed residential resales in March, 18% less than March 2021’s 3,212 closed sales. March marked a 49% increase compared to February 2022. The sales to list price ratio was 106.9% for all of Orange County. Foreclosures accounted for just 0.2% of all closed sales, and short sales accounted for 0.1%. That means that 99.7% of all sales were good ol’ fashioned sellers with equity.
Have a great week.
Sincerely,
Steven Thomas
Quantitative Economics and Decision Sciences
Copyright 2022- Steven Thomas, Reports On Housing – All Rights Reserved. This report may not be reproduced in whole or part without express written permission by Author.


