July 20, 2026
Housing has cooled considerably since earlier this year, and more sellers are languishing on the market without success.
Sitting on the Market
A telling 64% of all available homes have been on the market for at least one month, and 41% have surpassed two months.
Just about everyone loves to travel. Something is exciting about climbing aboard an airplane in anticipation of a much-needed vacation, often to some new and unfamiliar destination. After checking their bags and making their way through security, many travelers glance up at the electronic departure board only to find that their flight, along with most other flights, has been delayed. The delay may last an hour, or stretch on for several hours. Some flights may even be canceled, forcing travelers to scramble and make alternate arrangements. The excitement in flying quickly turns to frustration as the wait unfolds from an uncomfortable airport chair.
Many sellers are experiencing a similar delay. The excitement of coming onto the market, expecting to sell within the first few weeks, has turned to frustration as the wait unfolds to secure a buyer willing and able to write a purchase offer. After many showings and an open house or two, it’s crickets… no offers. Gone are the days of the COVID real estate market, from June 2020 through May 2022, when nearly every home sold instantly. The issue today is that buyer activity is low due to affordability constraints, and seller competition is at its highest level in years.
Nearly two-thirds of all available homes (64%) have been exposed to the market for at least 30 days. An eye-catching 41% have been lingering on the market for over two months. As expected, homes in the luxury ranges above $2.5 million are taking the longest to sell, with at least 50% on the market for two months or longer.
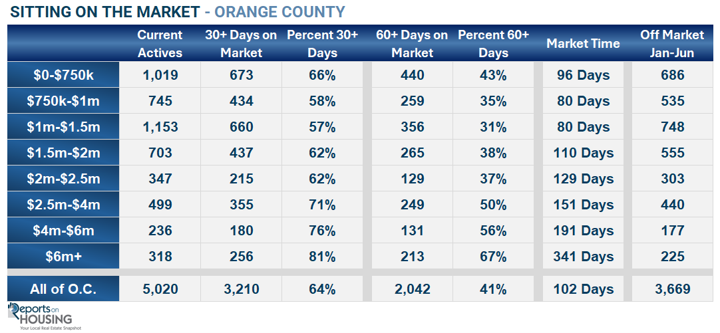
Yet, there are plenty of sellers in the more affordable ranges who are sitting on the market waiting for a buyer to come along and write a purchase offer. Below $750,000, 43% of the market has been waiting at least 60 days without success. From $750,000 to $2.5 million, between 31% and 38% have been waiting for two months or more.
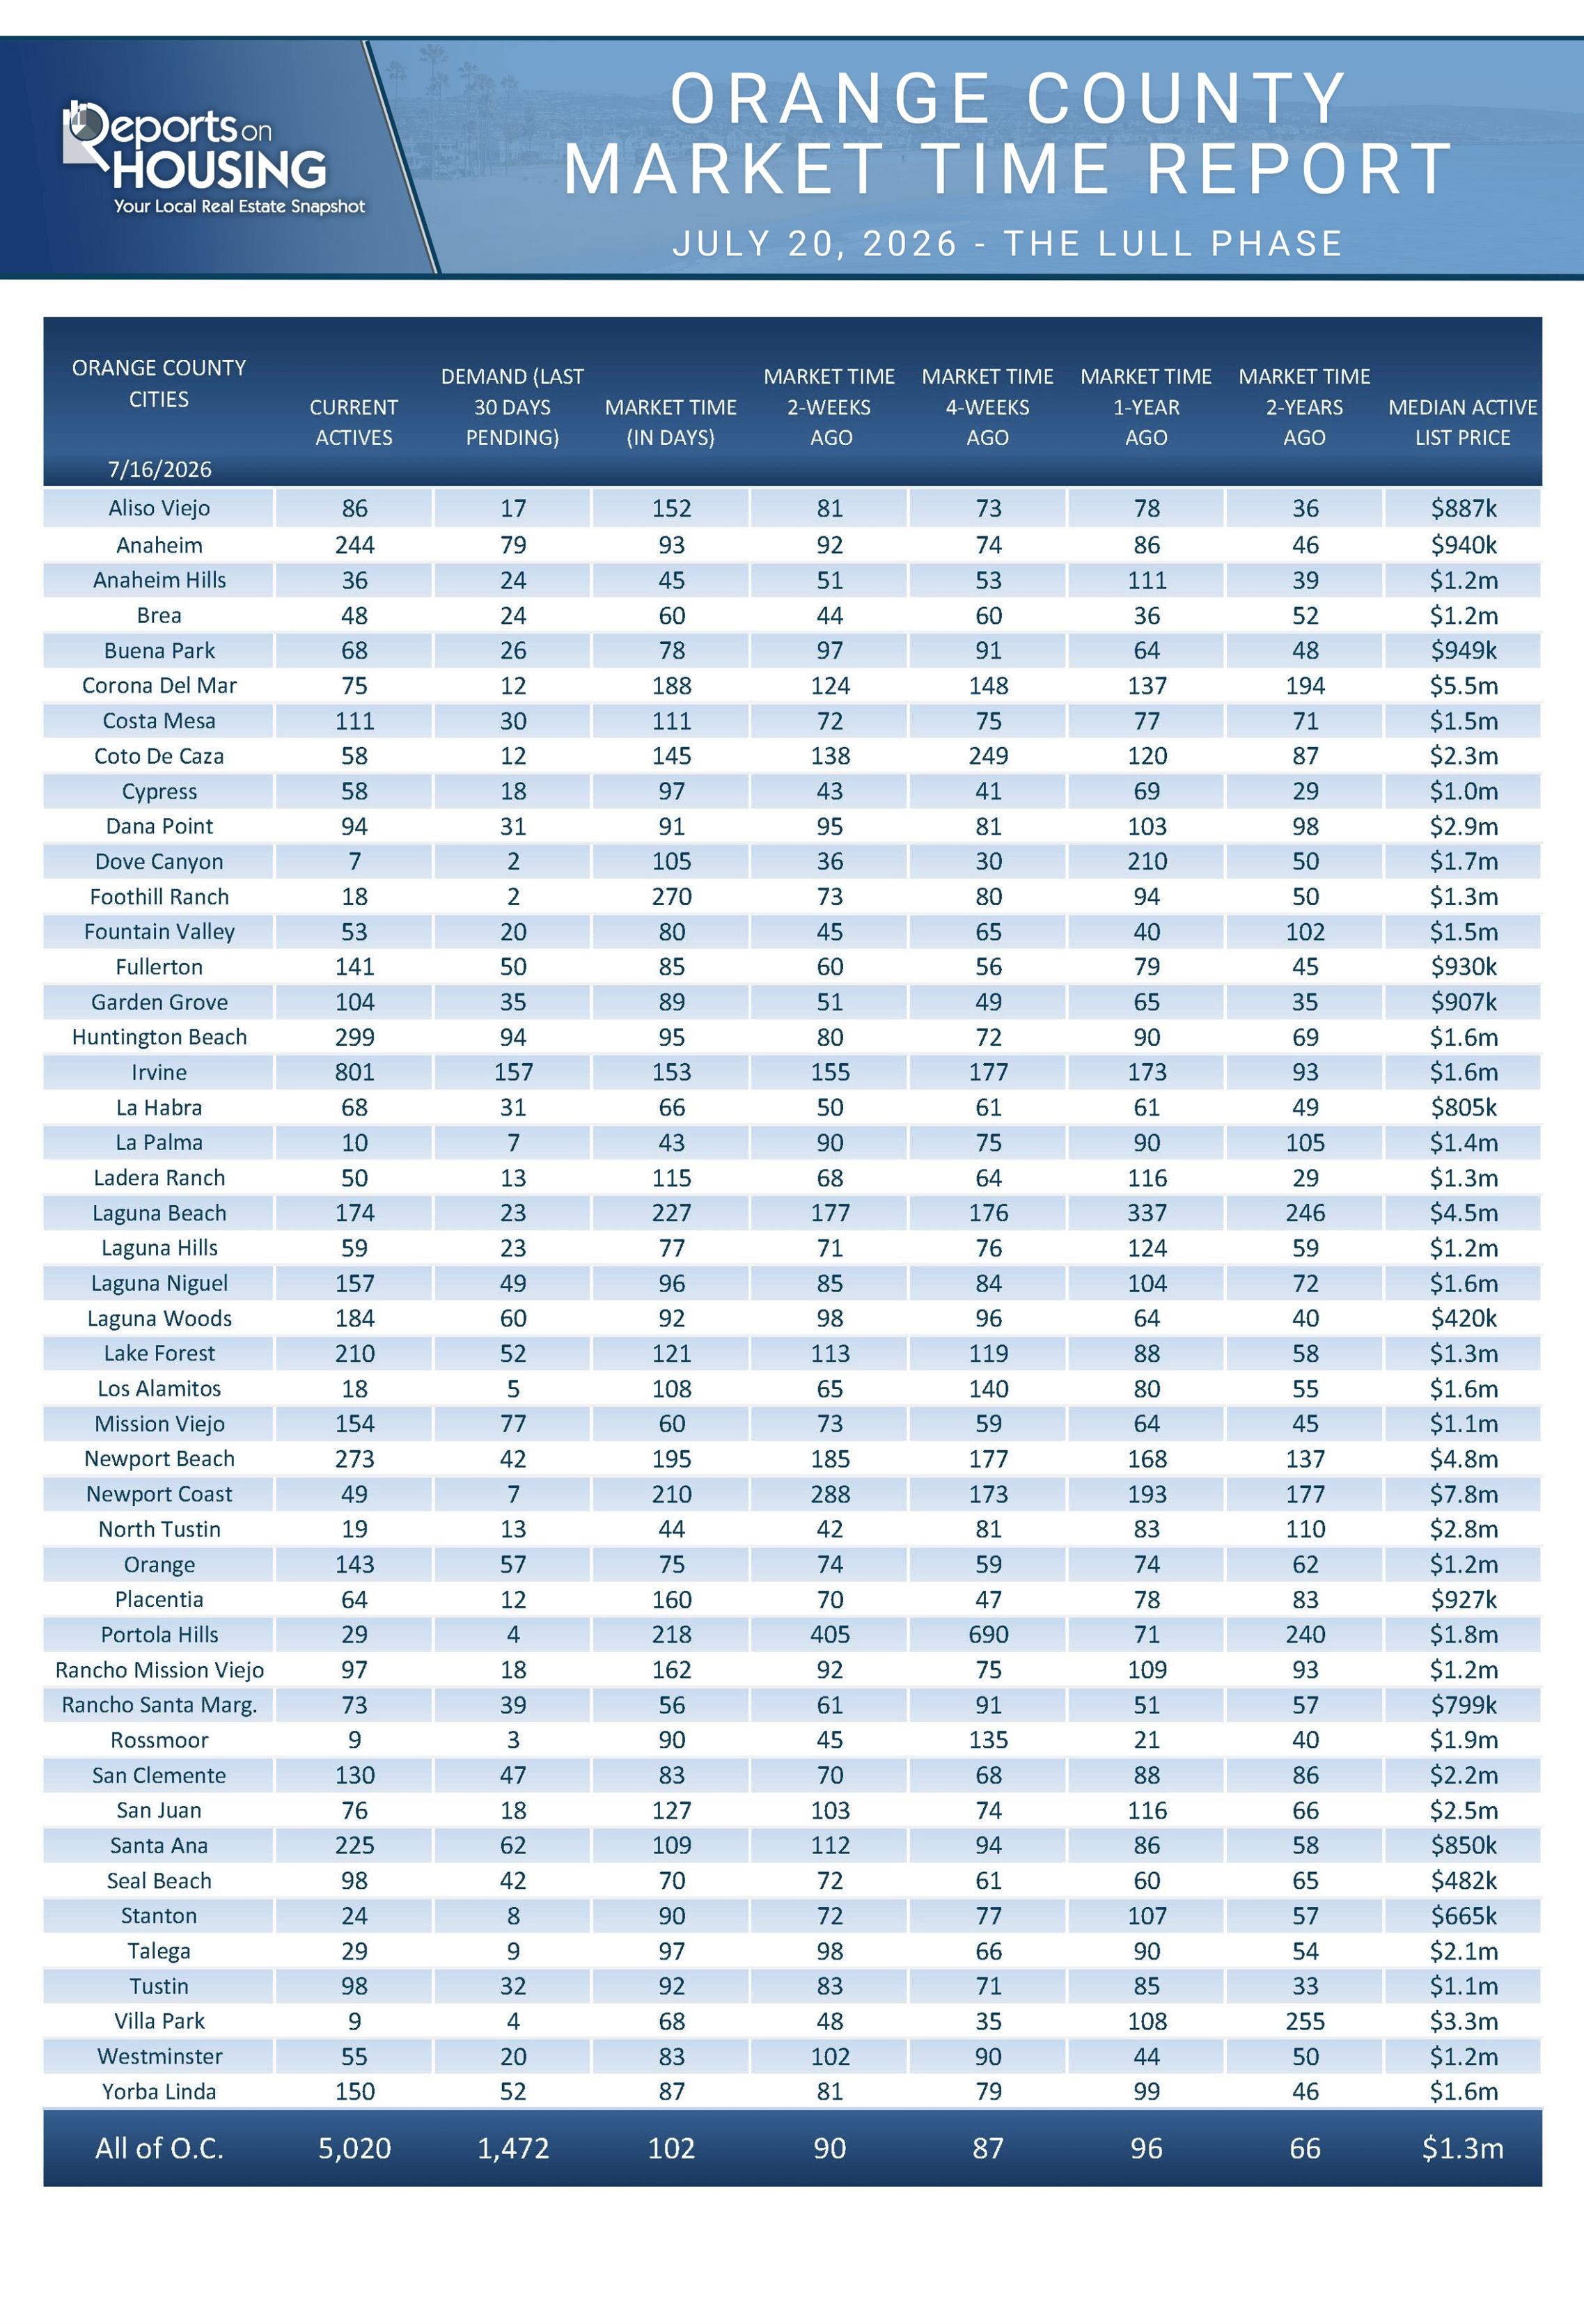
Over the past few years, the Orange County housing market has progressively slowed. Ever since rates climbed above 6% in September 2022, demand dropped substantially and has not changed much from year to year. Yet, more homeowners decided to sell each year, resulting in a higher inventory of available homes. The inventory climbed from 3,371 homes in mid-July 2023 to 5,020 homes today, an increase of 49%. At the same time, demand (a snapshot of the number of new pending sales over the prior month) reached 1,560 pending sales in mid-July 2023, compared to 1,472 today, a 6% decline. As a result of an increased supply and slightly lower demand, the Expected Market Time (the number of days it takes to sell all Orange County listings at the current buying pace) increased from 45 days in mid-July 2023 to 102 days today.
With unyielding low demand and heightened seller competition, many sellers have been sitting on the market for a very long time. Housing has reached the mid-point of the Summer Market. By the end of August, after the kids have gone back to school, housing will transition to the Autumn Market. The Spring Market, the busiest time of the year for pending sales activity, is in the rearview mirror. The window of opportunity to take advantage of the second best time of the year, the Summer Market, is closing. With so many sellers lingering on the market, many are opting to throw in the proverbial towel and pull their homes off the market.
From January through June, 3,669 sellers pulled their homes off the market, up 11% compared to 2025, up 102% compared to 2024, and up 79% compared to 2023. That 3,669 homes pulled off so far this year represents 73% of the current number of homes available for sale. Cyclically, an elevated number of homes are pulled off the market for the remainder of the year, dipping a bit in November, and then surging in December.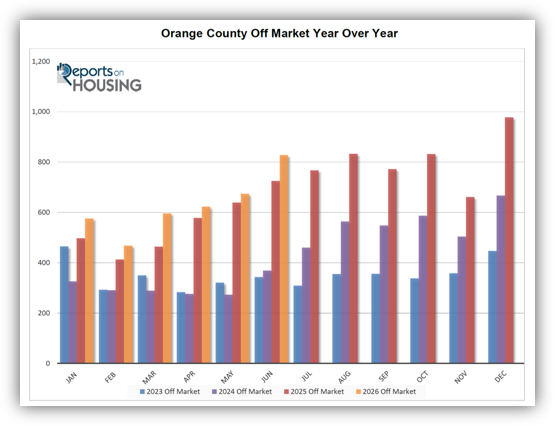
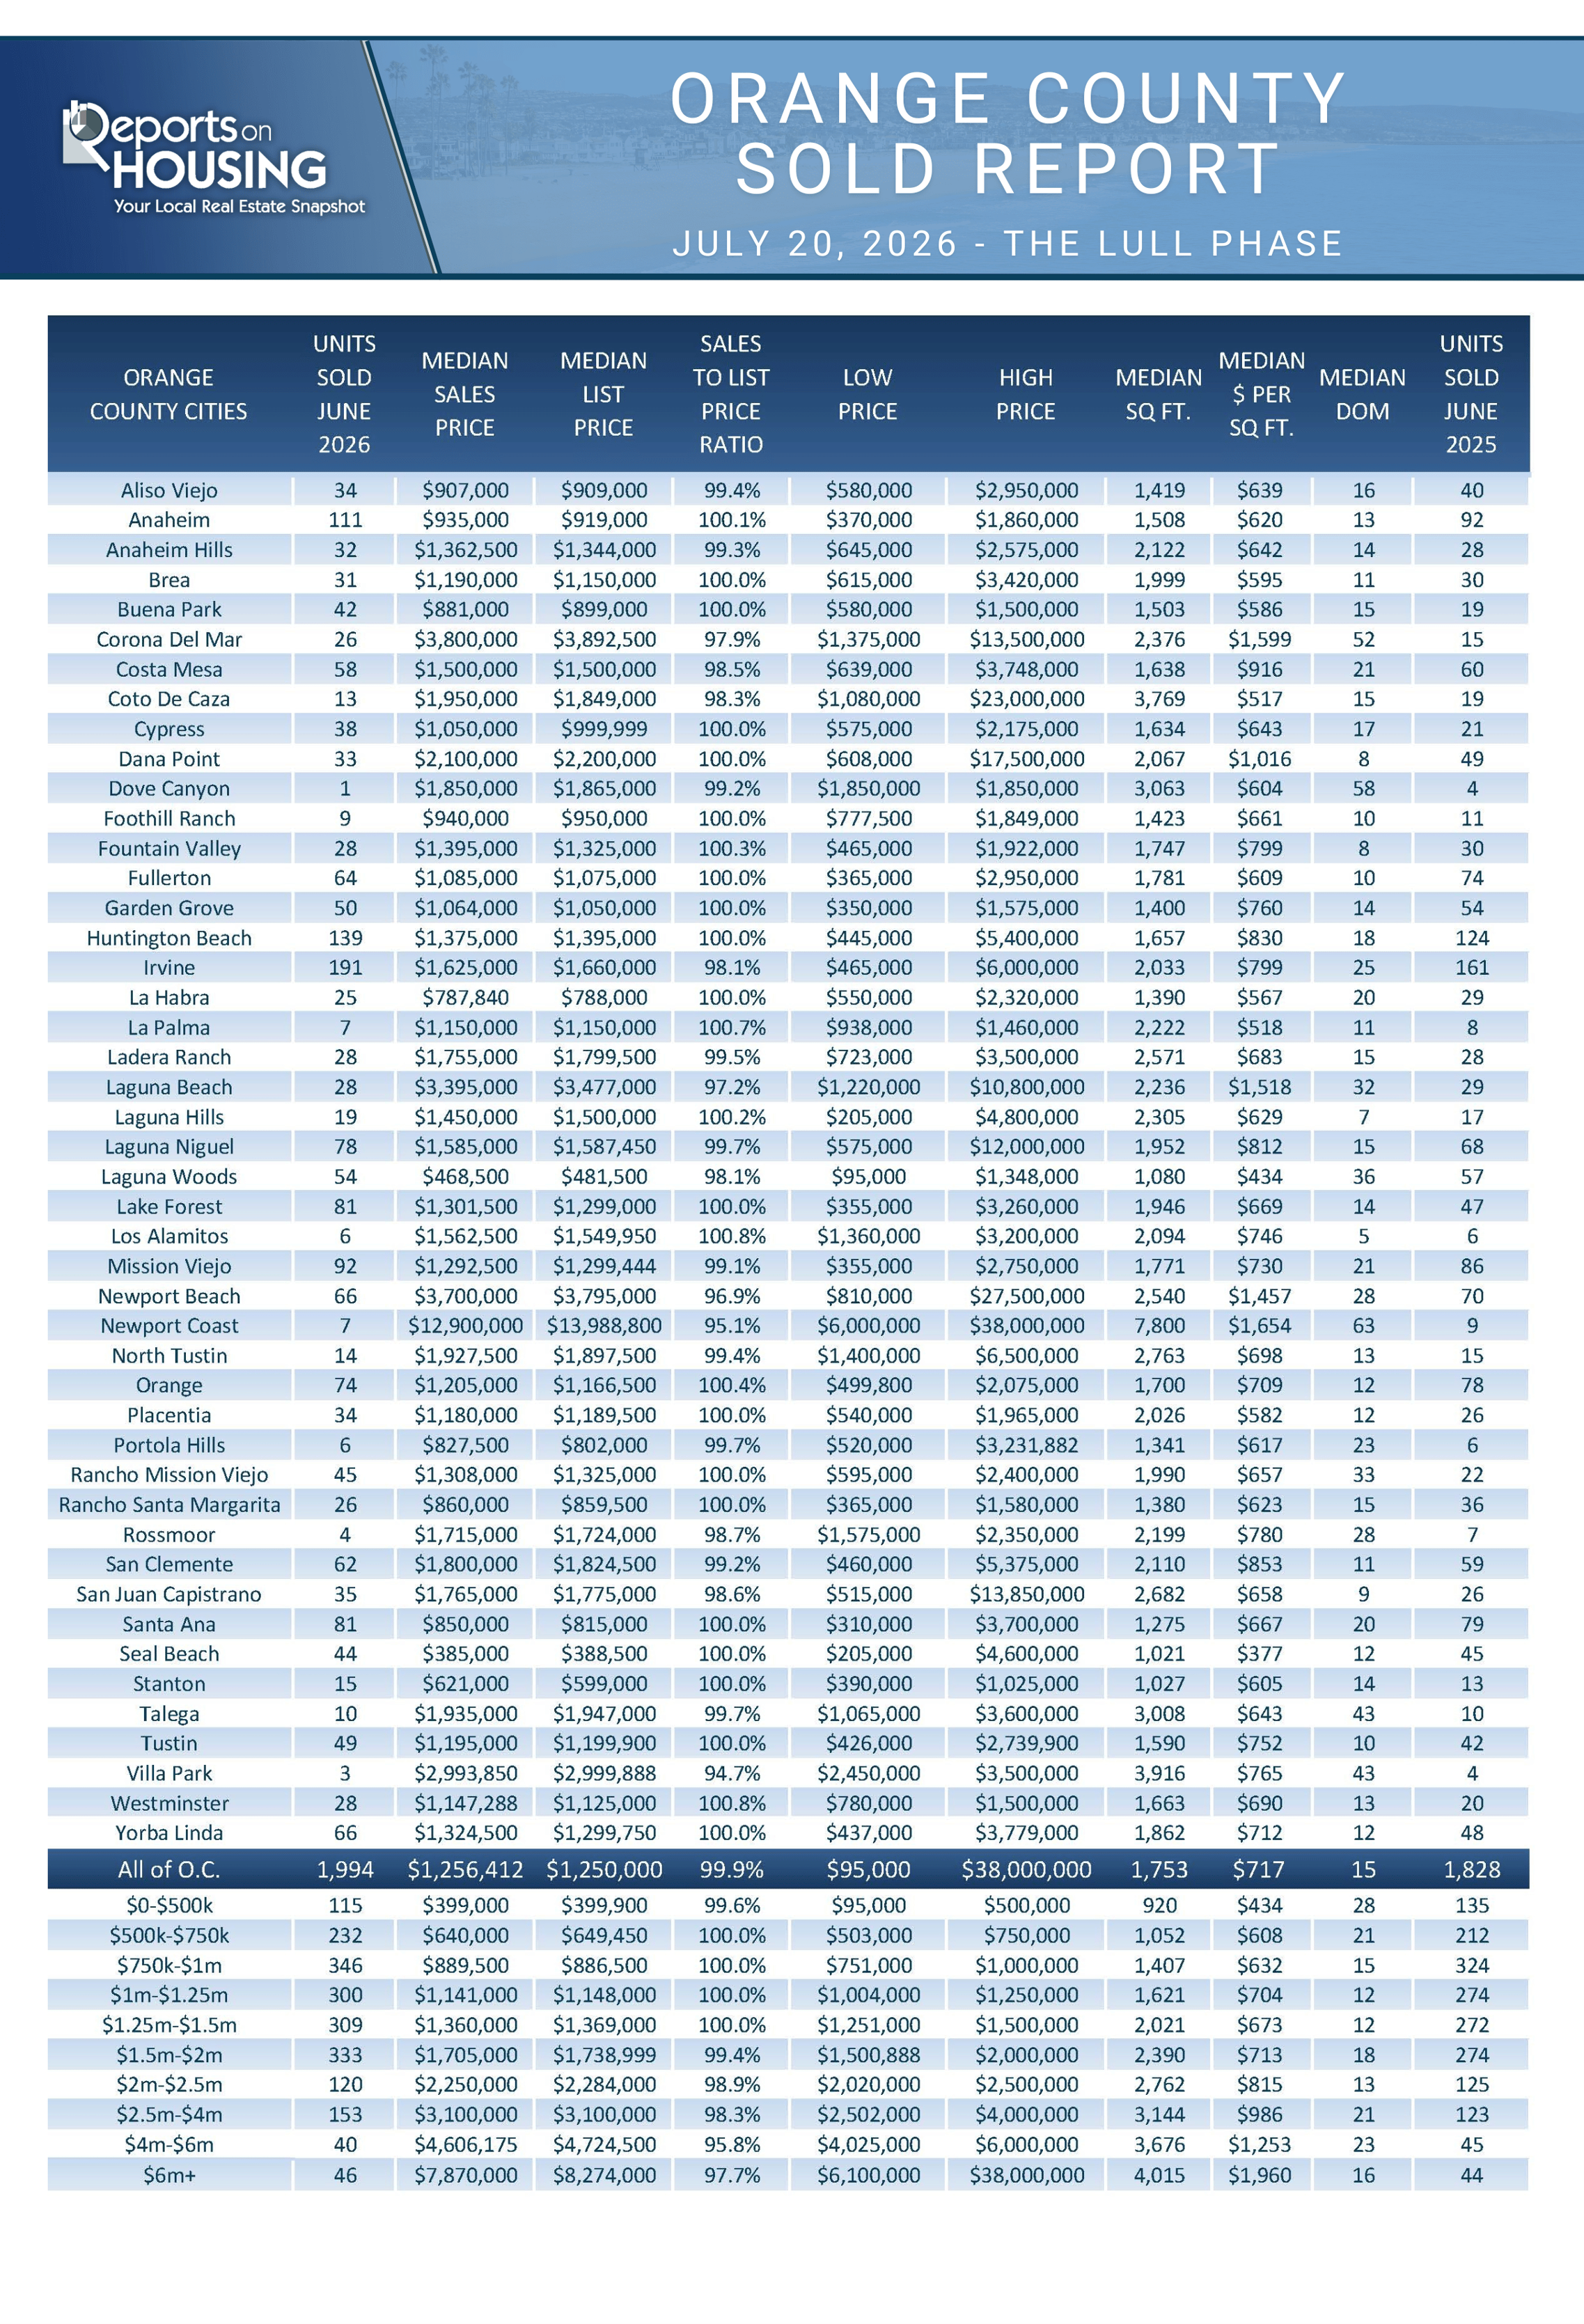
Due to the level of seller competition, sellers must prepare their home for sale carefully. Precise, methodical pricing based on all pendings and recent closed sales activity is one of the most crucial steps in securing a successful outcome. When a home is priced well and is in turnkey, ready-to-move-into condition, homes sell fast, even in today’s sluggish market. In June, 1,006 of the 1,994 closed sales sold within the first two weeks (50%). Price, condition, location, upgrades, and amenities all factor into the difference between success and languishing on the market.
The Orange County housing market has entered the “lull phase” of the year, when housing has reached a slower pace, homes linger on the market for longer, and more sellers pull their homes off the market. Today’s sellers have a choice: price their homes according to their Fair Market Value to secure a successful outcome, or throw in the towel and take the for-sale sign down.
Active Listings
The inventory surged higher in the past couple of weeks.
The active listing inventory increased by 323 homes over the past two weeks, up 7%, to 5,020, its highest level since last July. It was the largest increase since mid-January. The sharp rise coincided with a sudden drop in demand. This pattern occurred in 2024 as well. Orange County has not reached its annual peak yet either, typically occurring between July and August. If the rest of the year continues to follow the path of 2024, the inventory could peak a bit late in September.
Last year, the inventory was at 5,050 homes, 1% more than today, with 30 additional homes. The 3-year average before COVID (2017 through 2019) was 6,776, an additional 1,756 homes, or 35% more.
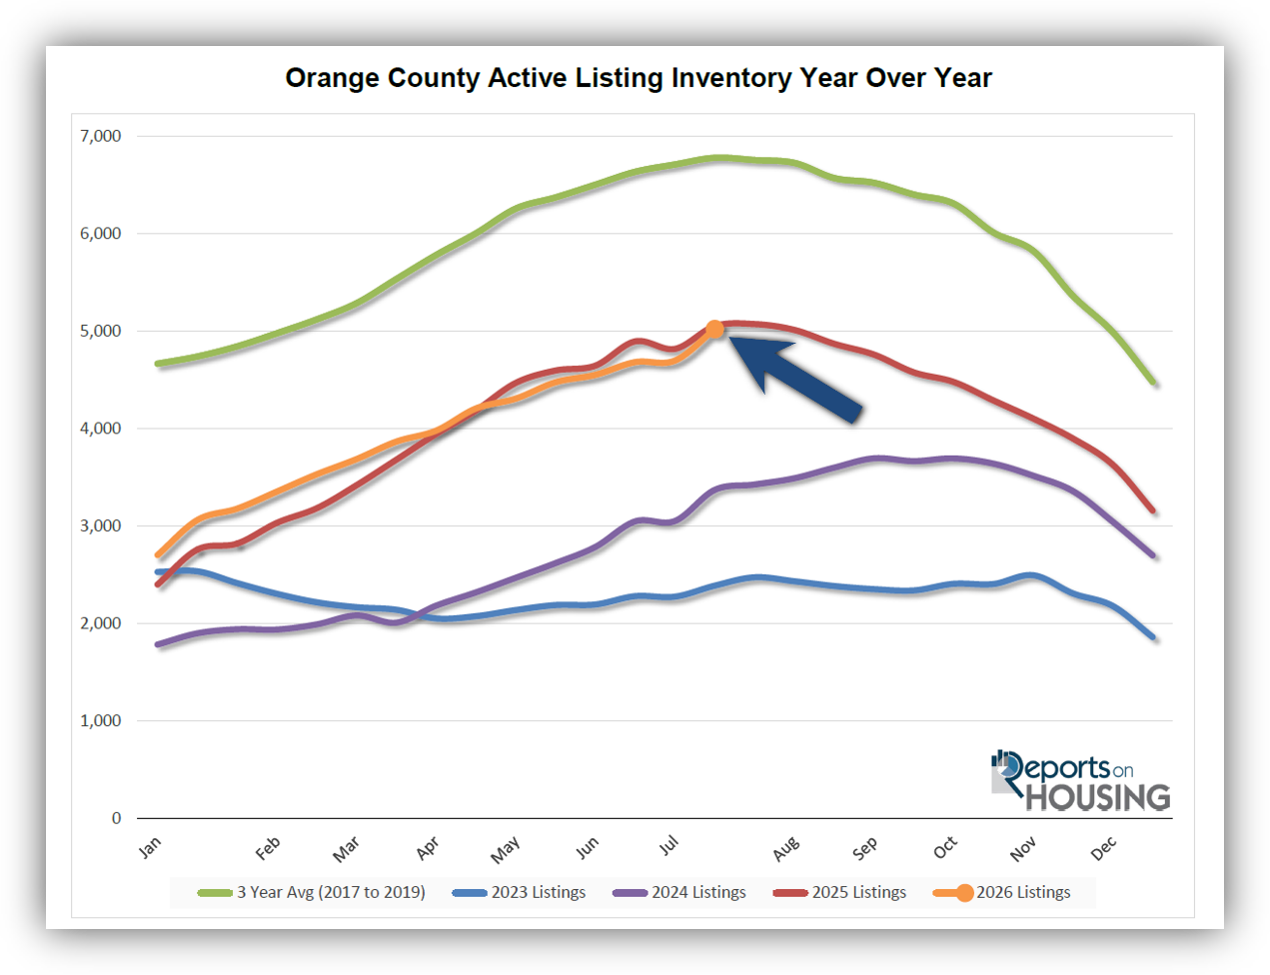
Homeowners continue to “hunker down” in their homes, unwilling to move because of their current, underlying, locked-in, low fixed-rate mortgage. This trend has been easing from the lows established in 2023. Through June, 15,943 homes were placed on the market in Orange County, 6,197 fewer than the 3-year average before COVID (2017-2019), 28% less. In 2025, 16,622 homes entered the market (4% more), compared with 14,386 in 2024 (10% fewer) and 12,346 in 2023 (23% fewer). Slightly fewer homes have been coming to market this year than last.
Demand
Demand plunged by 6% in the past couple of weeks.
Demand, a snapshot of the number of new pending sales over the prior month, decreased from 1,558 to 1,472 in the past couple of weeks, down 86 pending sales, or 6%, its largest drop of the year. It is the lowest mid-July reading since tracking began in 2004. This drop in demand coincides with rising mortgage rates. According to the Freddie Mac Primary Market Survey®, mortgage rates hit their highest level of the year, 6.55%, the highest rate since August of last year. Mortgage rates are the gas pedal for the housing market. As rates drop, it is the equivalent of stepping on the gas pedal and increasing the speed. As rates rise, it is comparable to letting off the pedal, decreasing the speed.
Last year, demand was 1,584, with 112 additional pending sales (+8%). The 3-year average before COVID (2017 to 2019) was 2,578 pending sales, 75% more than today, or an additional 1,106.
As the Federal Reserve has indicated, it is essential to monitor all economic releases for signs of a slowdown. These releases can cause mortgage rates to rise or fall, depending on how they compare with market expectations. It is also important to monitor any developments in the Iran conflict and its impact on the oil market, and ultimately inflation, which can also cause mortgage rates to rise or fall. This week marks the release of the S&P Global Manufacturing and Services Purchasing Managers Index (PMI), which tracks the strength of the U.S. manufacturing and services sectors. Next week, the Federal Reserve meets and will conduct a press conference to announce its decision on the Federal Funds rate. Finally, the Personal Consumption Expenditures – Price Index (PCE), the Fed’s preferred inflation gauge, will be released on Thursday, July 30th. 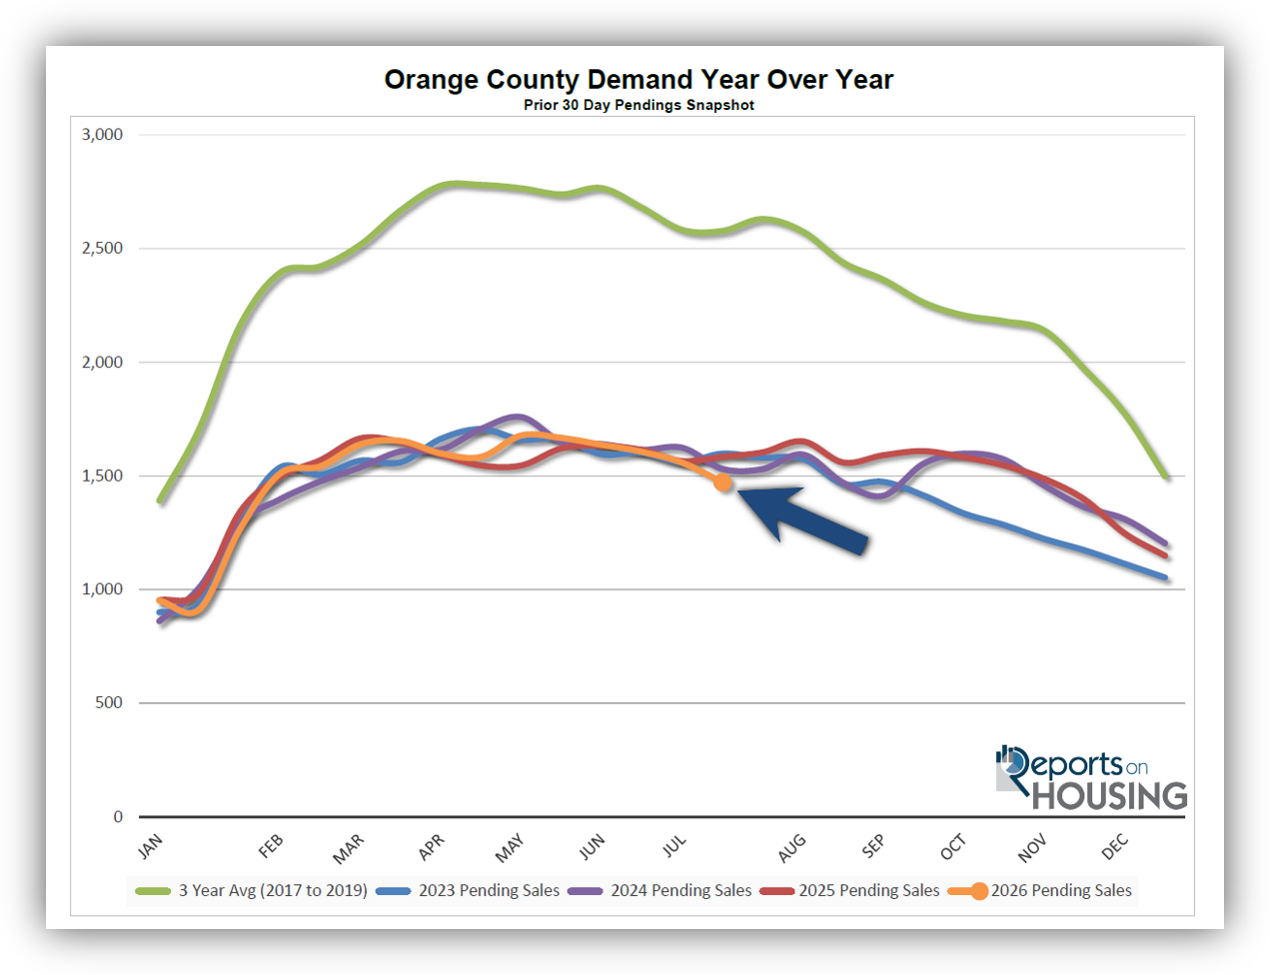
Expected Market Time
In the past two weeks, the market slowed by 12 days.
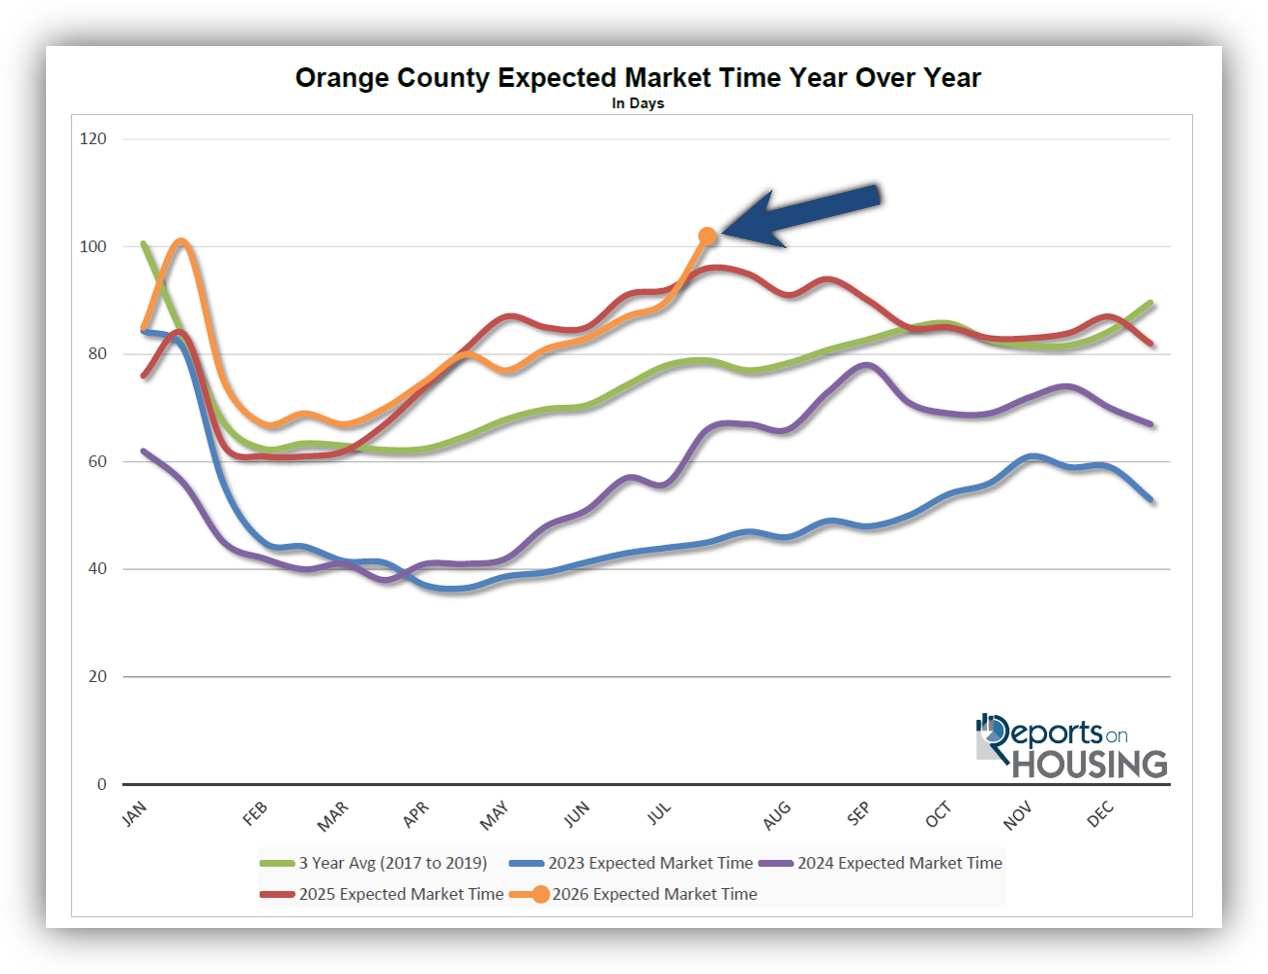
With the supply of available homes rising by 323 homes, up 7%, and demand falling by 86 pending sales, down 6%, the Expected Market Time (the number of days it takes to sell all Orange County listings at the current buying pace) increased from 90 to 102 days in the past couple of weeks, its highest level since the April 2020, during the COVID lockdown. Not including COVID, it was the slowest reading since January 2019.
Last year, it was 96 days, slightly faster than today. The 3-year average before COVID (2017 to 2019) was 80 days, considerably faster than today.
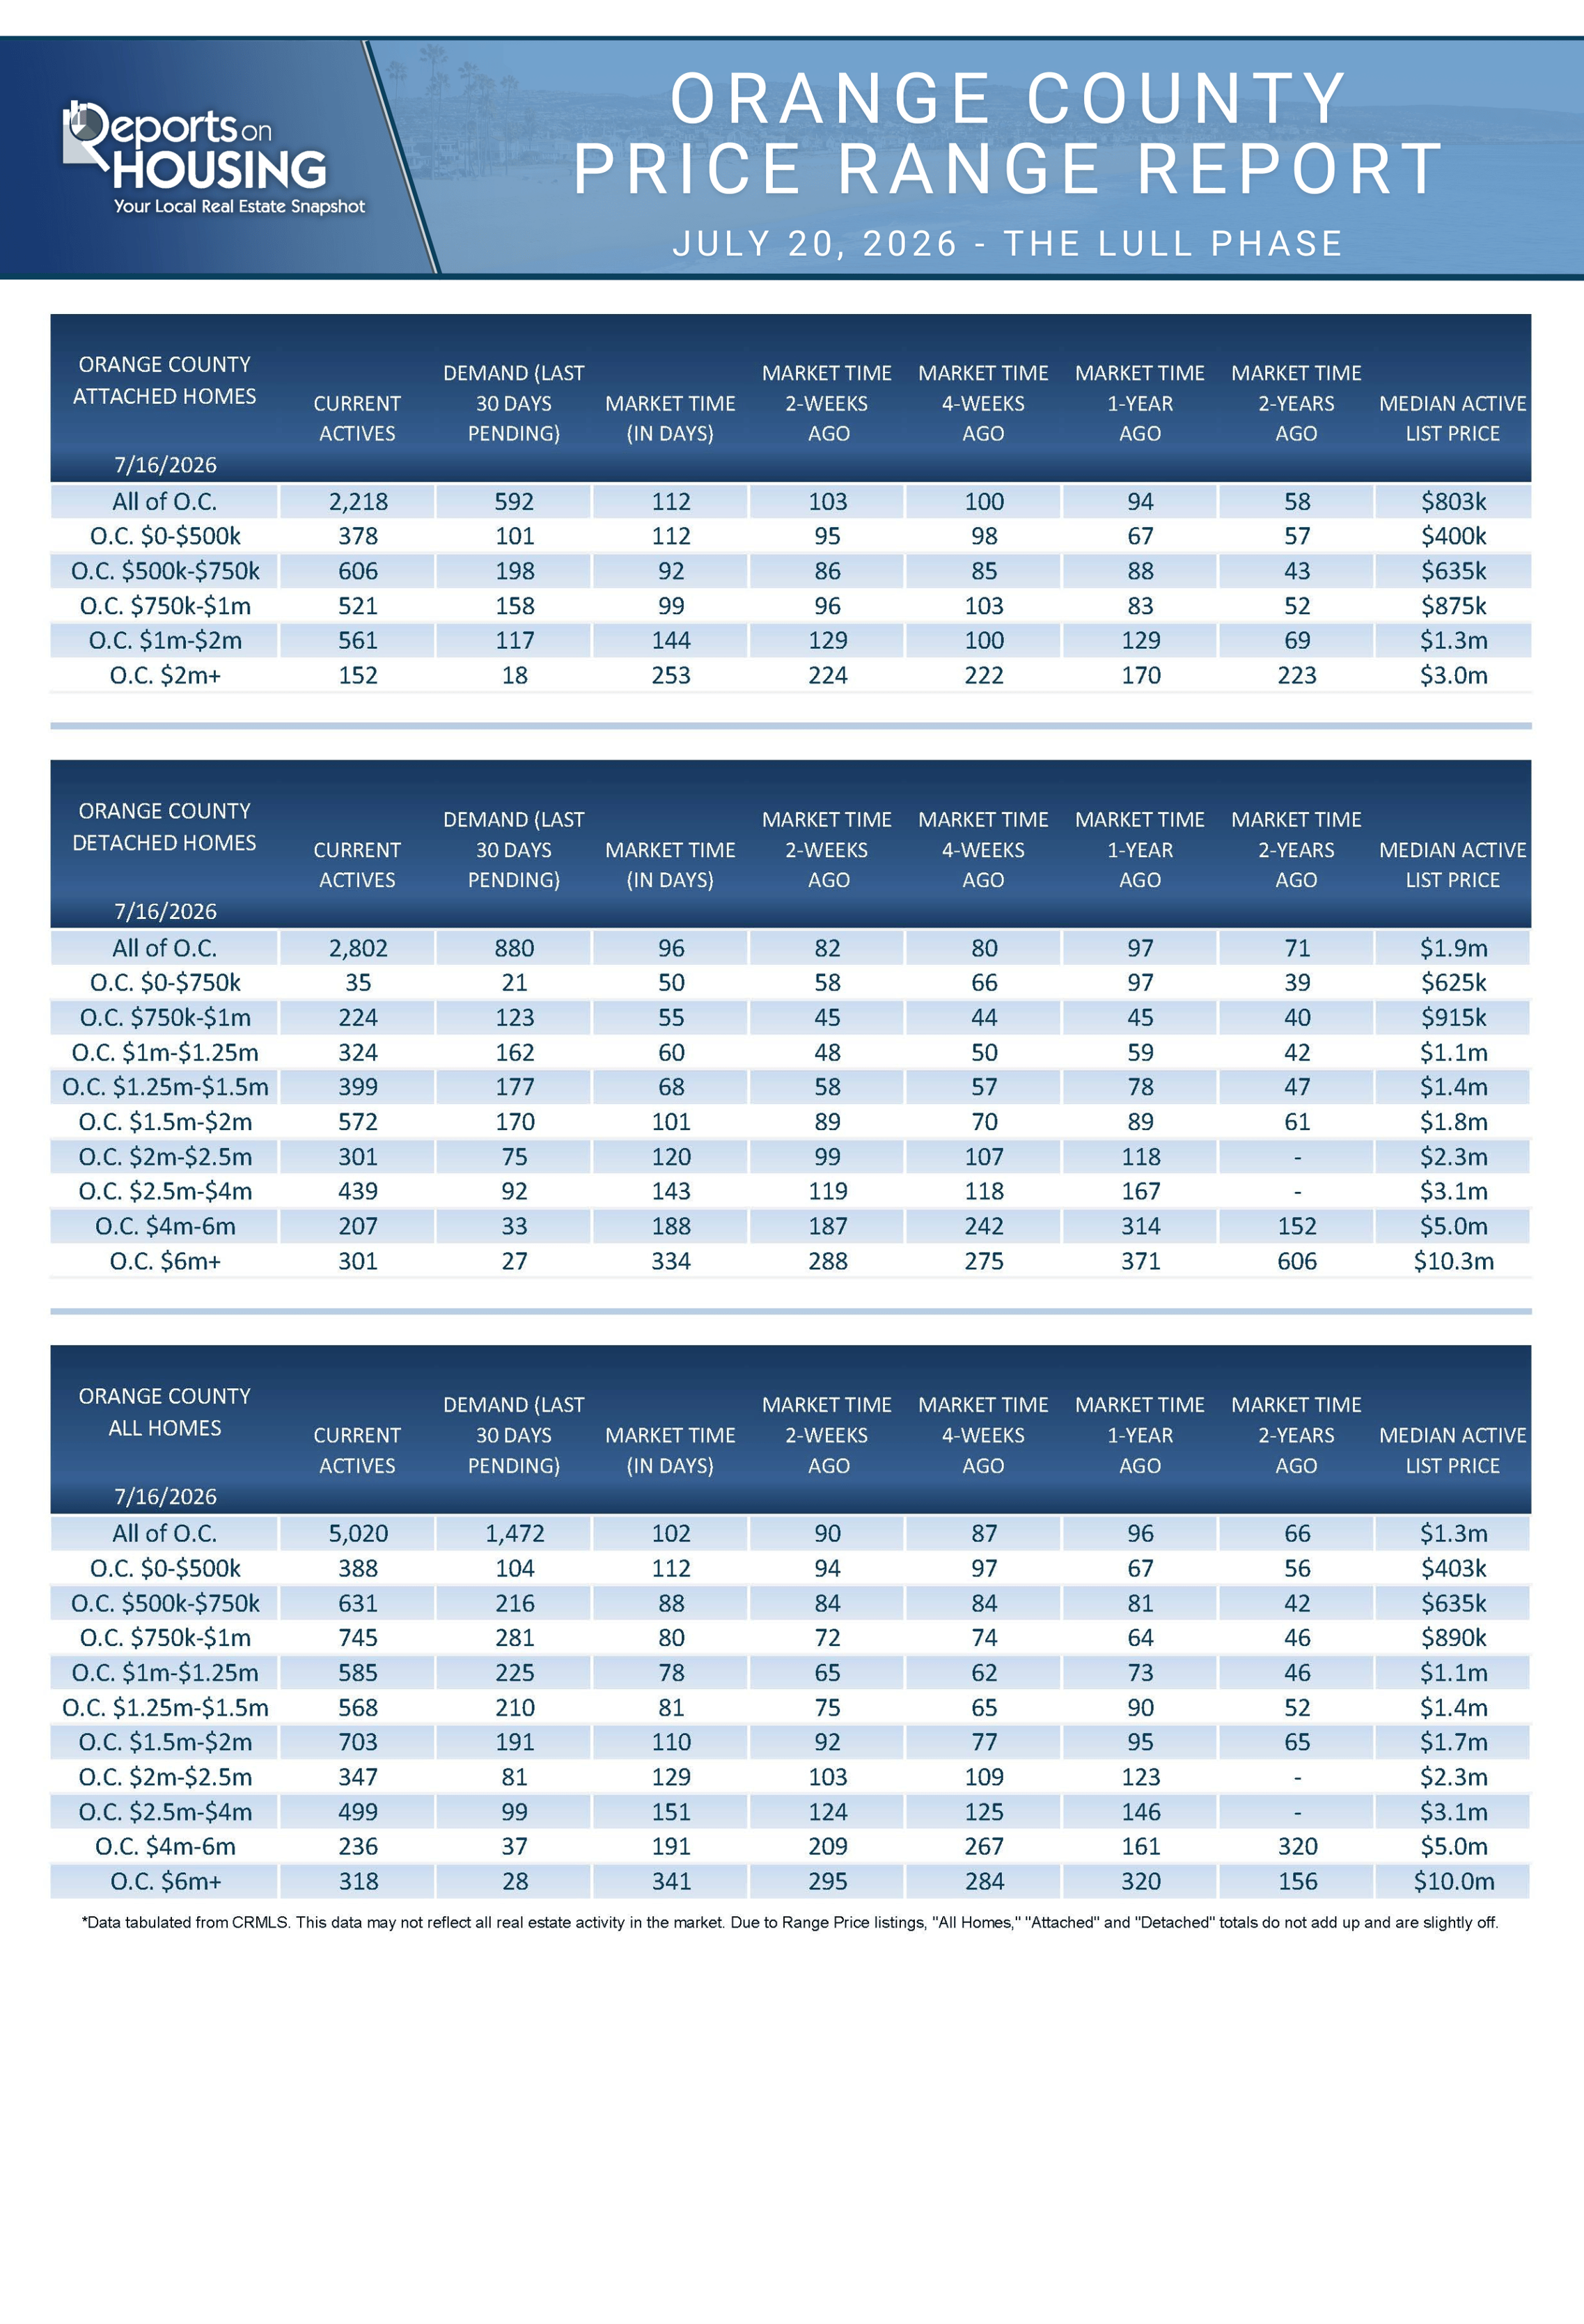
The Expected Market Time for condominiums and townhomes increased from 103 to 112 days in the past two weeks. It was 94 days last year. For detached homes, the Expected Market Time increased from 82 to 96 days. It was 97 days a year ago. The detached-home market remains significantly faster than the attached-home market.
Luxury End
The luxury market dramatically slowed in the past couple of weeks.
In the past couple of weeks, the luxury inventory of homes priced above $2.5 million (the top 10% of the Orange County housing market) increased from 1,029 to 1,053, a rise of 24 (+2%). Luxury demand decreased from 181 to 164, down 17 (-9%). With supply rising and demand falling, the Expected Market Time for luxury homes priced above $2.5 million increased from 171 to 193 days, its highest level since mid-January. Expect the luxury market to remain sluggish for the remainder of the year.
Year over year, the active luxury inventory is down by 180 homes (-15%), and luxury demand is down by 2 pending sales (-1%). Last year’s Expected Market Time was 223 days, slower than today.
In the past two weeks, the Expected Market Time for homes priced between $2.5 million and $4 million increased from 124 to 151 days. For homes priced between $4 million and $6 million, the Expected Market Time decreased from 209 to 191 days. For homes priced above $6 million, the Expected Market Time increased from 295 to 341 days. Luxury is at 193 days overall. At this pace, a seller would be looking at becoming a pending sale around January 2027.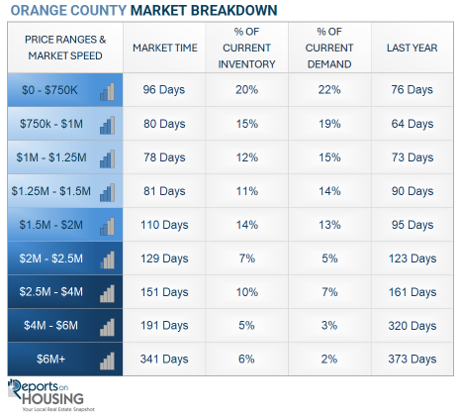
Orange County Housing Summary
· INVENTORY: The active listing inventory in the past couple of weeks increased by 323 homes, up 7%, and now stands at 5,020, its largest rise since the first couple of weeks of the year. Last year, there were 5,050 homes on the market, 30 additional homes, or 1% more. The 3-year average before COVID (2017 to 2019) was 6,776, which is 35% higher. From January through June, 28% fewer homes came on the market than the 3-year average before COVID (2017 to 2019), 6,197 fewer. There were 679 fewer than last year, 1,557 more than in 2024, and 3,597 more than in 2023.
· DEMAND: Buyer demand, the number of pending sales over the prior month, decreased by 86 in the past two weeks, down 6%, and now stands at 1,472, its largest drop of the year, and its lowest level since January. Last year, there were 1,584 pending sales, up 8%. The 3-year average before COVID (2017 to 2019) was 2,578, which is 75% higher than today.
· MARKET TIME: With the inventory rising substantially and demand falling considerably, the Expected Market Time, the number of days to sell all Orange County listings at the current buying pace, increased from 90 to 102 days in the past couple of weeks, its highest reading since April 2020 during the COVID lockdown. Last year, it was 96 days, slightly faster than today. The 3-year average before COVID (2017-2019) was 80 days, faster than today.
· LUXURY: In the past two weeks, the Expected Market Time for homes priced between $2.5 million and $4 million increased from 124 to 151 days. For homes priced between $4 million and $6 million, the Expected Market Time decreased from 209 to 191 days. For homes priced above $6 million, the Expected Market Time increased from 295 to 341 days.
· DISTRESSED HOMES: Short sales and foreclosures combined comprised only 0.2% of all listings and 0.4% of demand. Four foreclosures and four short sales are available today in Orange County, bringing the total of distressed homes on the active market to eight, down two from two weeks ago. Last year, 6 distressed homes were on the market, similar to today.
· CLOSED SALES: There were 1,994 closed residential resales in June, up 9% compared to June 2025’s 1,828 sales, and up 10% from May 2026. The sales-to-list price ratio in Orange County was 99.9%. Foreclosures accounted for 0.1% of all closed sales, and short sales accounted for 0.3% as well. That means that 99.7% of all sales were sellers with equity.
Have a great week.
Sincerely,
Steven Thomas
Quantitative Economics and Decision Sciences
Copyright 2026—Steven Thomas, Reports On Housing—All Rights Reserved. This report may not be reproduced in whole or in part without the author’s express written permission.