May 26, 2026
Mortgage rates surged in 2022 and have remained elevated, squeezing home affordability and keeping demand sluggish ever since.
Low Demand and Affordability
Today’s monthly payment is 71% of the Orange County median household’s monthly income.
Everyone needs a break from cooking, and going out is the answer. But it is far more expensive than it used to be. A meal that cost $10 in 2000 has more than doubled since then, rising to $24 today. A Disneyland ticket in 2000 cost $41, compared to $169 during the summer and $224 on weekends in late June and July 2026. A grande vanilla latte at Starbucks has climbed from $3.05 in 2000 to $5.45 today, a 79% increase. How about the monthly cost of streaming on Netflix? It has ballooned by 150% from $7.99 in 2011 to $19.99 today, rising by $2 since last year alone. Inflation has made everything more expensive, but some costs have risen far beyond the overall rate of inflation.
Similarly, housing costs have risen sharply, straining home affordability and impacting buyer demand. In looking at home affordability, it is not just prices. It is essential to consider mortgage rates, home prices, and incomes. Mortgage rates have been much higher than where they are today, but that does not mean it was more unaffordable. In 1980, the average mortgage rate was 13.75%, the median income was $22,000, and the median detached sales price was $108,000. That meant the monthly housing payment was 55% of the median household income. Rates continued to drop, and incomes climbed decade after decade. In 2000, mortgage rates were at 8%; the median income had more than doubled since 1980, rising to $56,000; and the median detached sale price climbed to $317,000. Yet, the monthly payment was only 40% of the median income.
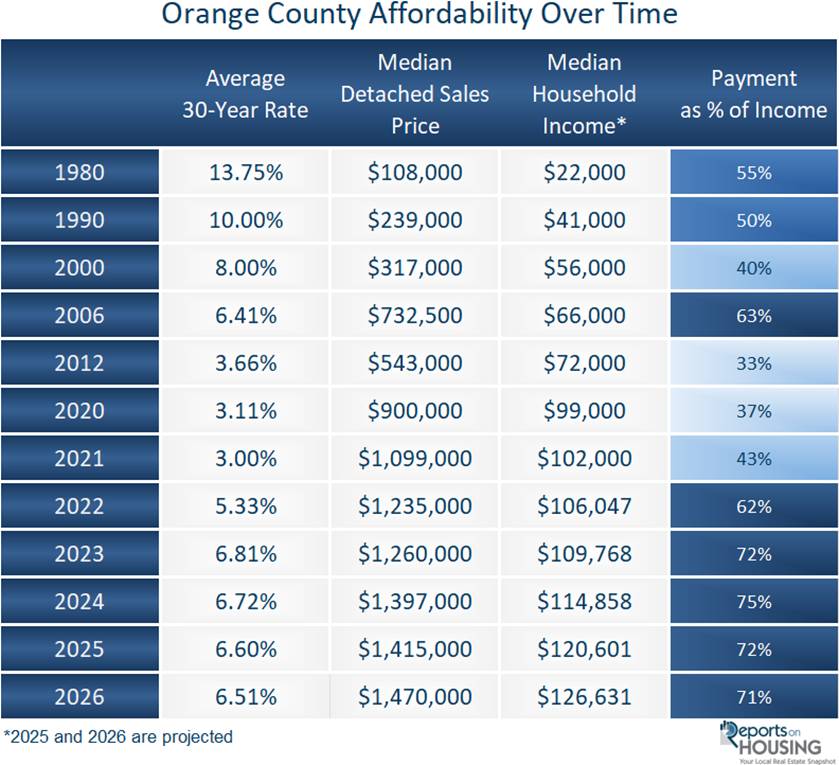
By 2006, just before the Great Recession, the monthly payment had ballooned to 63% of the median household income as prices soared by 131% in just six years. By 2012, prices had dropped by 26%, mortgage rates had plunged from 6.41% in 2006 to 3.66% in 2012, and incomes had grown by 9%. Home affordability improved dramatically, and the monthly payment for the median-priced home was only 33% of income. Homes remained affordable through 2020, just before the run-up in home values during COVID.
During the pandemic, home values surged from $900,000 in 2020 to $1,235,000 by 2022, a 37% increase. Incomes only rose by 7%, yet mortgage rates jumped from 3.11% to 5.33%. The combination of substantially higher home prices and rapidly rising mortgage rates significantly squeezed home affordability. In response to high inflation, which peaked at 9% in June 2022, the Federal Reserve raised the Federal Funds Rate 11 consecutive times from March 2022 through July 2023. By 2022, the monthly payment for the median-priced home jumped to 62% of the median household income. In 2023, with rates at 6.81%, that share increased to 72%. By 2024, it reached 75%. Today, with rates falling to 6.51% and incomes outpacing the rise in home prices, affordability has slowly improved. The monthly payment for the median-priced home has dropped to 71% of the median household income.
Affordability remains the number one obstacle to homeownership for many prospective buyers, and it continues to show up in buyer demand, which has remained muted and virtually unchanged since 2023. Current demand (a snapshot of new pending sales over the prior month) is 1,667. At the end of May last year, it was 1,621. In 2024, it was 1,650, and in 2023 it was 1,665. By comparison, the 3-year average before COVID (2017 to 2019) was 2,738 pending sales. That is an additional 1,071 pending sales, or 64% higher than today.
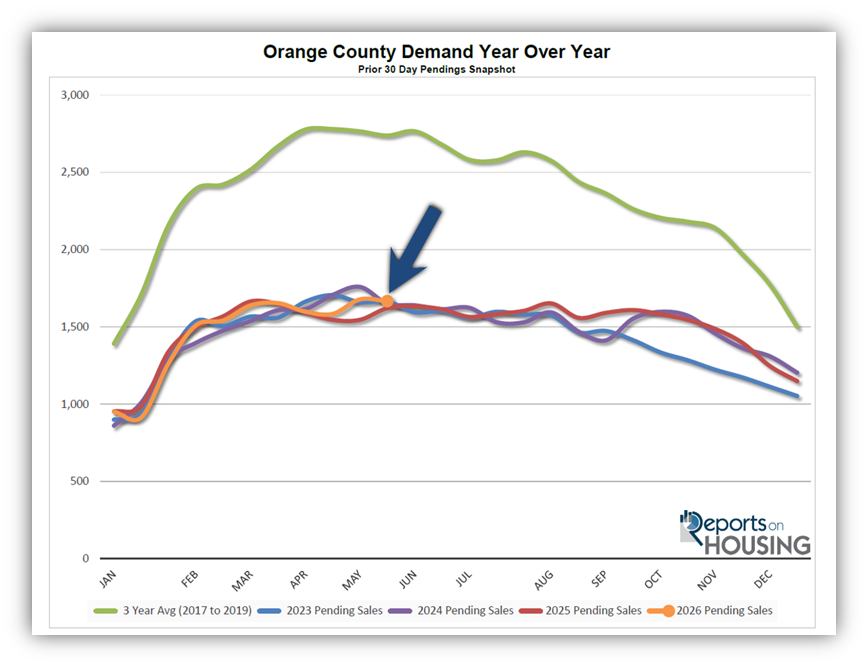
Buyer demand will remain muted until affordability improves. If mortgage rates drop back down to 6%, where they were at the end of February, and incomes continue to rise by 5% per year, the payment will drop to 67% of the median household income. If rates dropped to 5.5%, the payment would fall further to 63%. Improving affordability would strengthen demand and push it above levels seen in recent years. The frozen Orange County housing market would begin to thaw, resulting in many more pending sales and, ultimately, more closed sales. Until then, affordability will remain the primary obstacle preventing many prospective buyers from purchasing a home.
Active Listings
The inventory increased by 4% in the past couple of weeks.
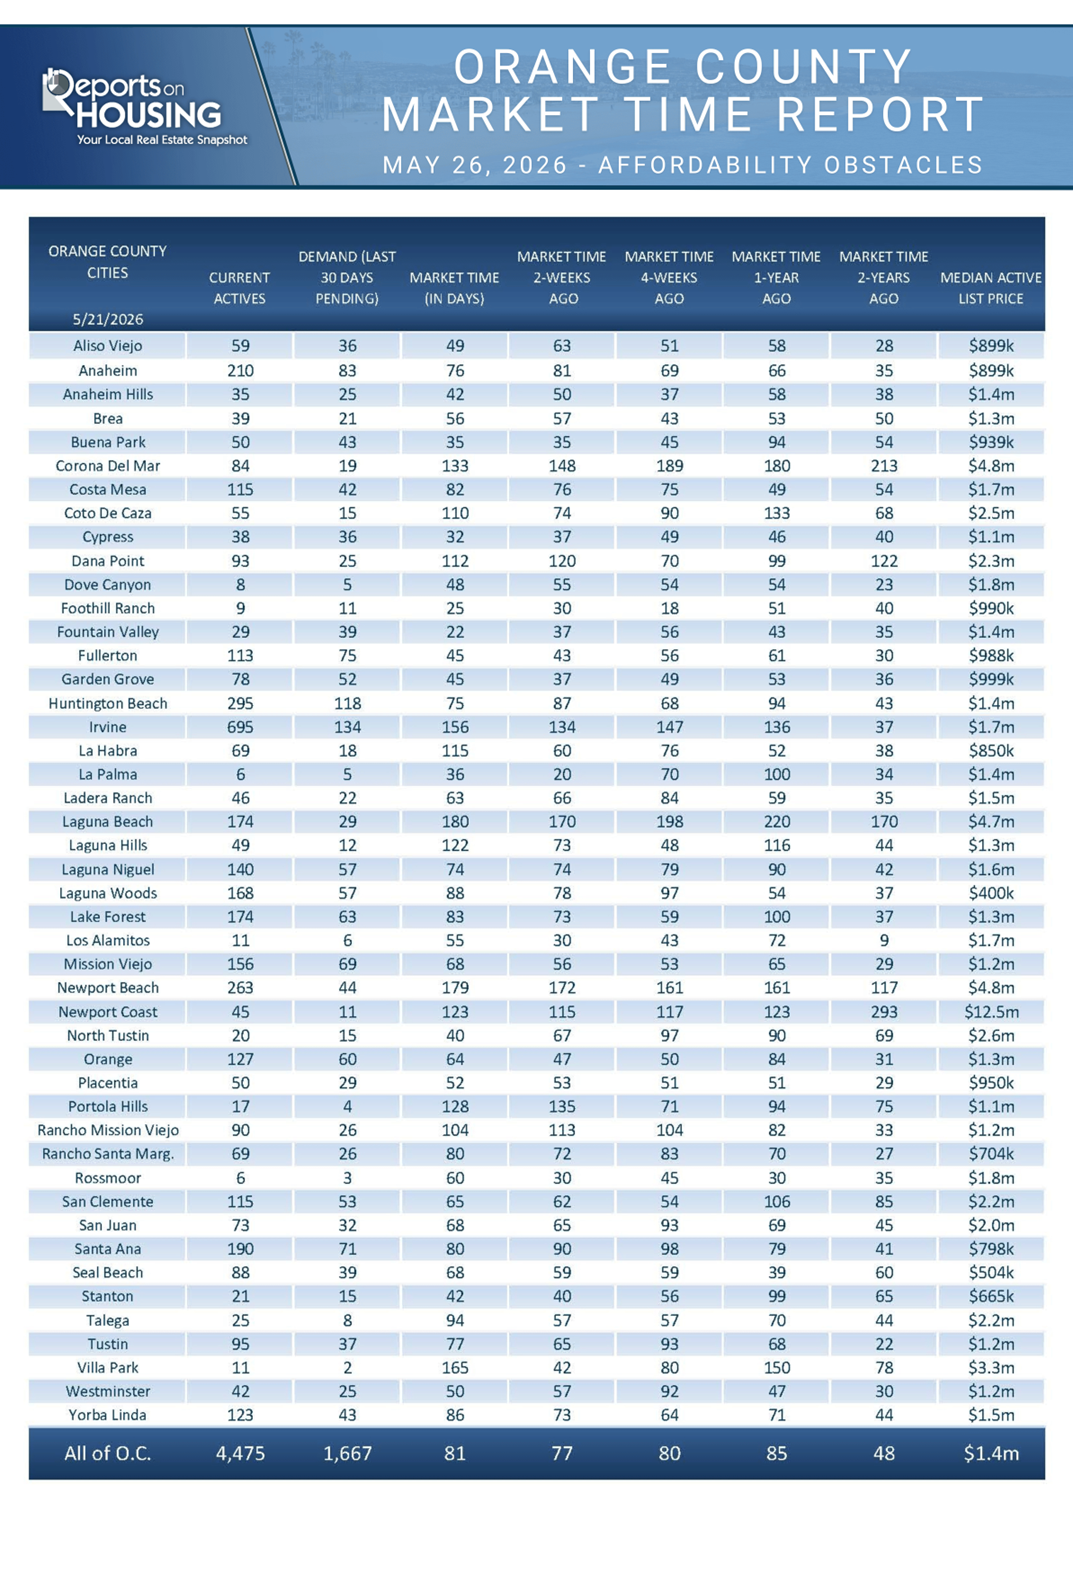
The active listing inventory increased by 168 homes over the past two weeks, up 4%, to 4,475. It is the tail end of the Spring Market, and demand appears to have peaked a couple of weeks ago. With an elevated number of homes coming to market and demand slowly falling, the inventory will continue to grow until it peaks sometime in the summer, between July and August. That means there will be increasing competition among sellers until a peak is reached.
Last year, the inventory was at 4,595 homes, 3% more than today, with 120 additional homes. The 3-year average before COVID (2017 through 2019) was 6,370, an additional 1,895 homes, or 42% more.
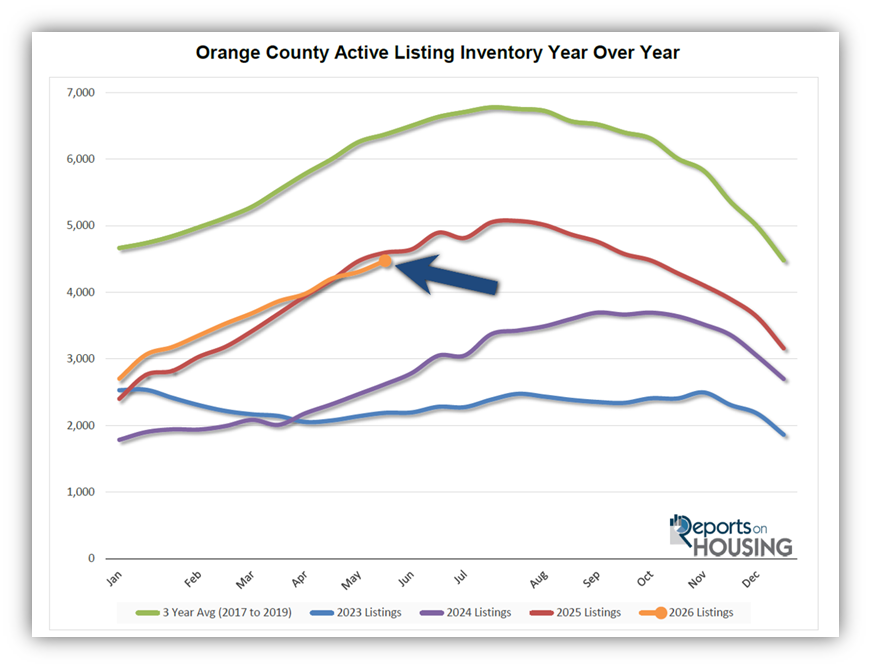
Homeowners continue to “hunker down” in their homes, unwilling to move because of their current, underlying, locked-in, low fixed-rate mortgage. This trend has been easing from the lows established in 2023. Through April, 10,584 homes were placed on the market in Orange County, 3,530 fewer than the 3-year average before COVID (2017-2019), 25% less. In 2025, 10,949 homes entered the market (3% more), compared to 9,102 in 2024 (14% less), and 7,752 in 2023 (27% less). Slightly fewer homes have been coming to market this year than last.
Demand
Demand decreased by 1% in the past couple of weeks.
Demand, a snapshot of the number of new pending sales over the prior month, decreased from 1,678 to 1,667 in the past couple of weeks, down 11 pending sales, or 1%. It appears that demand established its annual peak a couple of weeks ago. Demand typically peaks during the Spring Market between April and May. From here, expect demand to fall slowly for the remainder of the year. Ever since the start of the conflict in Iran at the end of February, rates have been rising. As rates rise, it is tapping the brakes on demand. The path of demand will be determined by where rates head from here. An end to the conflict could push rates below 6.5% again, to levels seen between September 2025 and mid-March. Improved affordability would increase demand. Yet if the conflict persists, rates could rise further, curtailing buyer demand.
Last year, demand was 1,621, with 46 fewer pending sales (3% lower). The 3-year average before COVID (2017 to 2019) was 2,765 pending sales, 65% more than today, or an additional 1,087.
As the Federal Reserve has indicated, it is essential to monitor all economic releases for signs of a slowdown. These releases can cause mortgage rates to rise or fall, depending on how they compare with market expectations. It is also important to monitor any developments in the Iran conflict and its impact on the oil market, and ultimately inflation, which can also cause mortgage rates to rise or fall. This week, the Personal Consumption Expenditures – Price Index (PCE), the Fed’s preferred inflation gauge, will be released on Friday. Next week is jobs week, which includes the number of job openings, wages, and the number of jobs created or lost, one of the month’s most important economic data points. Additionally, the S&P Global Manufacturing and Services Purchasing Managers Index (PMI), which tracks the strength of the U.S. manufacturing and services sectors, will be released.
Expected Market Time
In the past two weeks, the market time has increased by four days.
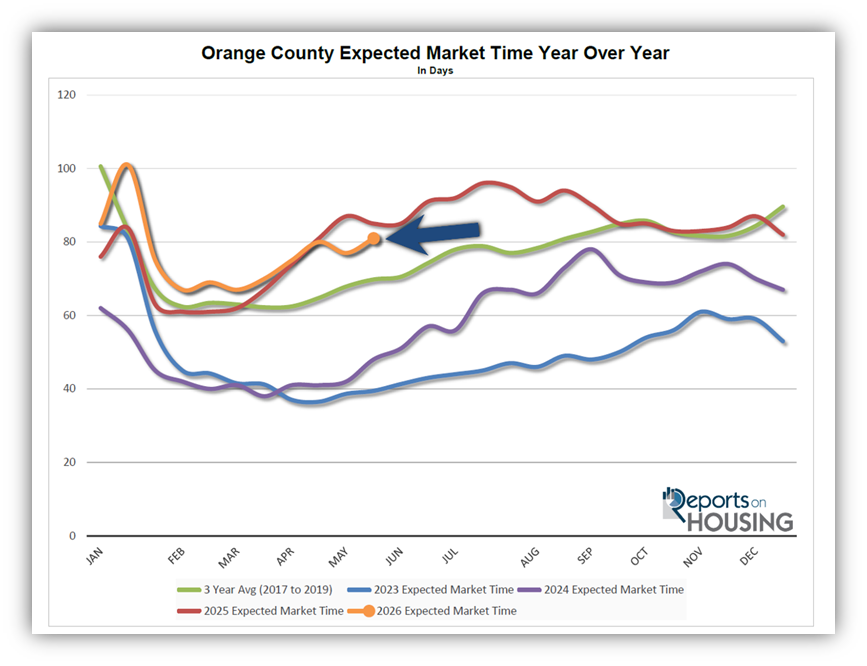
With the supply of available homes rising by 168 homes, up 4%, and demand falling by 11 pending sales, down 1%, the Expected Market Time (the number of days it takes to sell all Orange County listings at the current buying pace) increased from 77 to 81 days in the past couple of weeks.
Last year, it was 85 days, similar to today. The 3-year average before COVID (2017 to 2019) was 70 days, faster than today.
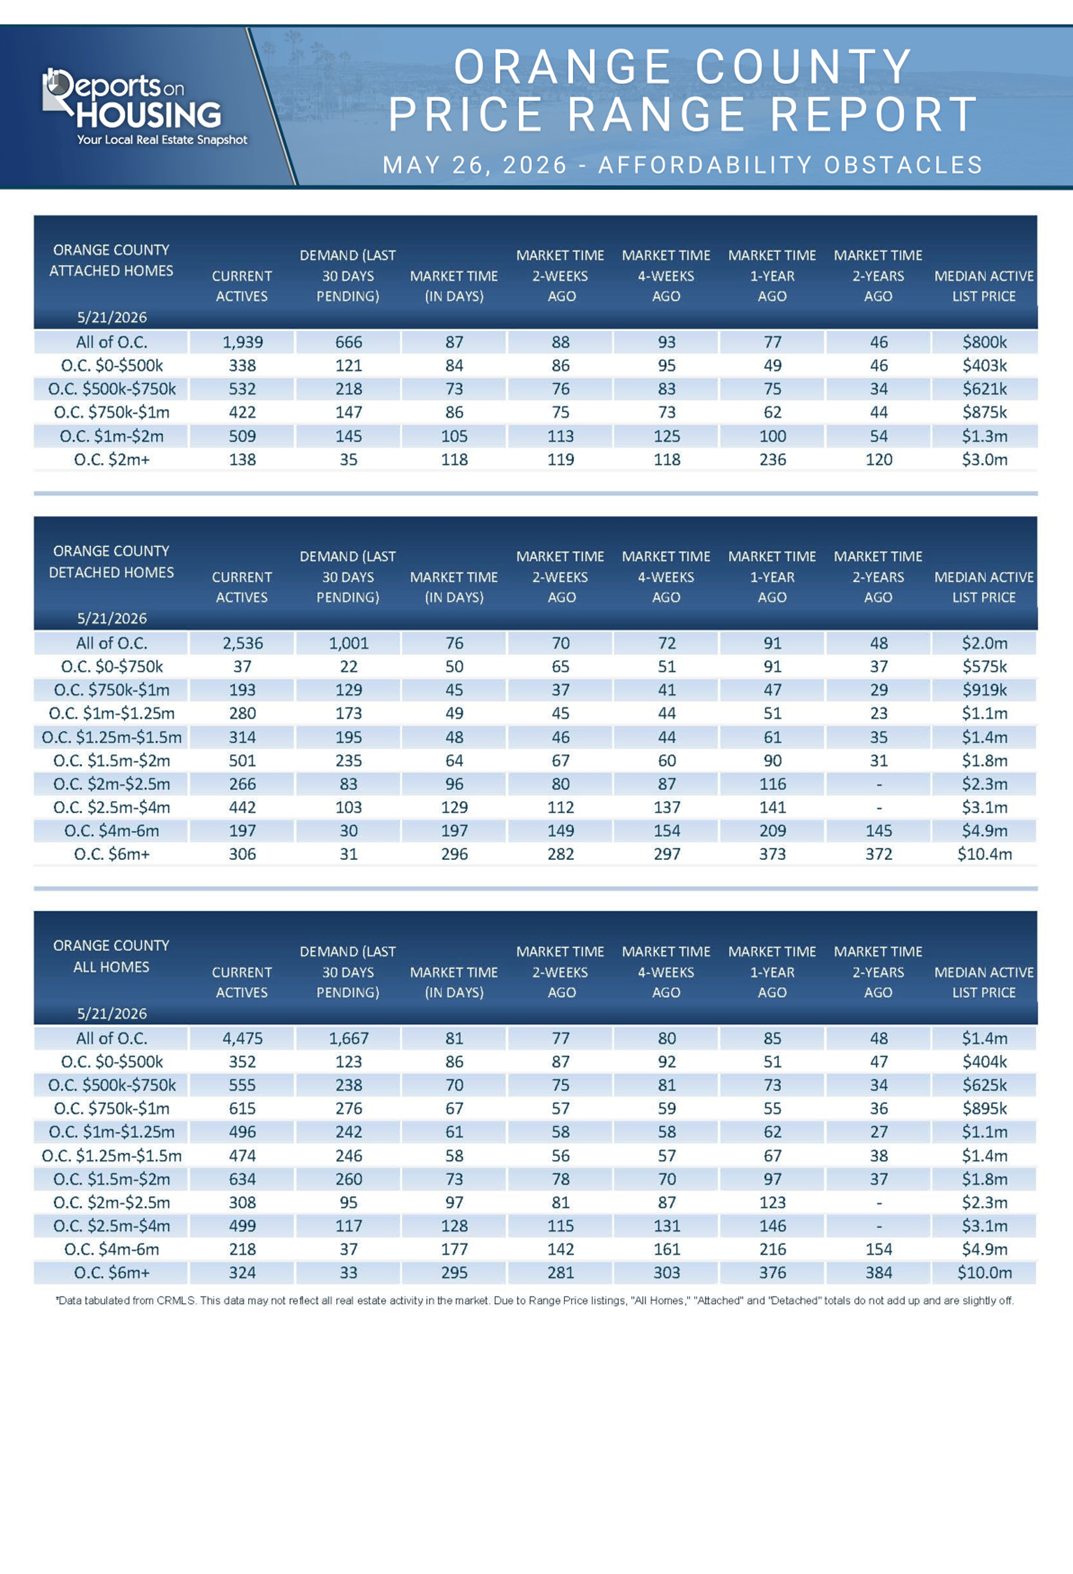
The Expected Market Time for condominiums and townhomes decreased from 88 to 87 days in the past two weeks. It was 77 days last year. For detached homes, the Expected Market Time increased from 70 to 76 days. It was 91 days a year ago. The detached-home market remains faster than the attached-home market.
Luxury End
The luxury market slowed over the past couple of weeks.
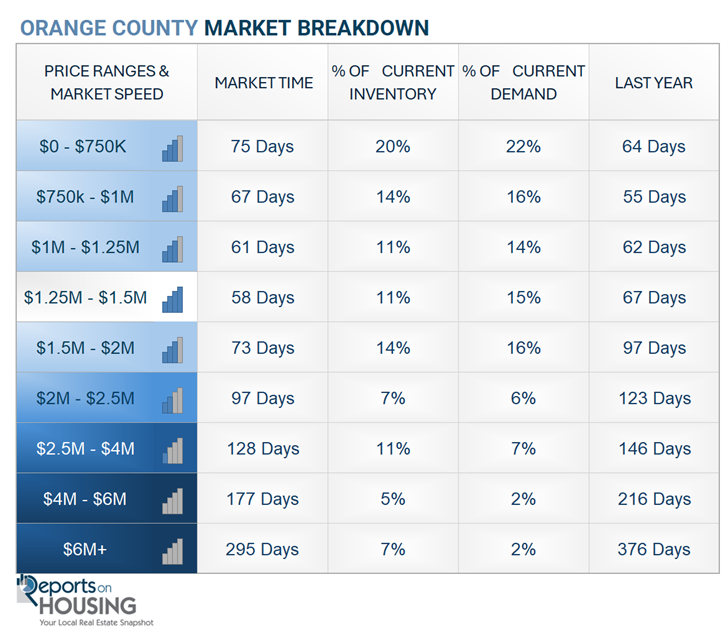
In the past couple of weeks, the luxury inventory of homes priced above $2.5 million (the top 10% of the Orange County housing market) increased from 987 to 1,041, up 54, or 5%. Luxury demand decreased by 12 pending sales, down 6%, to 199. With supply rising and demand falling, the Expected Market Time for luxury homes priced above $2 million increased from 149 to 167 days, its slowest reading since January. Like the rest of the market, the luxury market is beginning to slow.
Year over year, the active luxury inventory is down by 177 homes (-15%), and luxury demand is down by 1 pending sale (-1%). Last year’s Expected Market Time was 194 days, slower than today.
In the past two weeks, the Expected Market Time for homes priced between $2.5 million and $4 million increased from 115 to 128 days. For homes priced between $4 million and $6 million, the Expected Market Time increased from 142 to 177 days. For homes priced above $6 million, the Expected Market Time increased from 281 to 295 days. Luxury is at 167 days overall. At this pace, a seller would be looking at becoming a pending sale around November 2026.
Orange County Housing Summary
- INVENTORY: The active listing inventory in the past couple of weeks increased by 168 homes, up 4%, and now stands at 4,475. Last year, there were 4,595 homes on the market, 120 additional homes, or 3% more. The 3-year average before COVID (2017 to 2019) was 6,370, which is 42% higher. From January through April, 25% fewer homes came on the market than the 3-year average before COVID (2017 to 2019), 3,530 fewer. There were 365 fewer than last year, 1,482 more than in 2024, and 2,832 more than in 2023.
- DEMAND: Buyer demand, the number of pending sales over the prior month, decreased by 11 in the past two weeks, down 1%, and now stands at 1,667. It appears demand peaked a couple of weeks ago. Last year, there were 1,621 pending sales, 3% fewer. The 3-year average before COVID (2017 to 2019) was 2,765, which is 65% higher than today.
- MARKET TIME: With the inventory rising and demand falling, the Expected Market Time, the number of days to sell all Orange County listings at the current buying pace, increased from 77 to 81 days in the past couple of weeks. Last year, it was 85 days, similar to today. The 3-year average before COVID (2017-2019) was 70 days, faster than today.
- LUXURY: In the past two weeks, the Expected Market Time for homes priced between $2.5 million and $4 million increased from 115 to 128 days. For homes priced between $4 million and $6 million, the Expected Market Time increased from 142 to 177 days. For homes priced above $6 million, the Expected Market Time increased from 281 to 295 days.
- DISTRESSED HOMES: Short sales and foreclosures combined, comprised only 0.2% of all listings and 0.4% of demand. Three foreclosures and six short sales are available today in Orange County, bringing the total of distressed homes on the active market to nine, down one from 2 weeks ago. Last year, four distressed homes were on the market, similar to today.
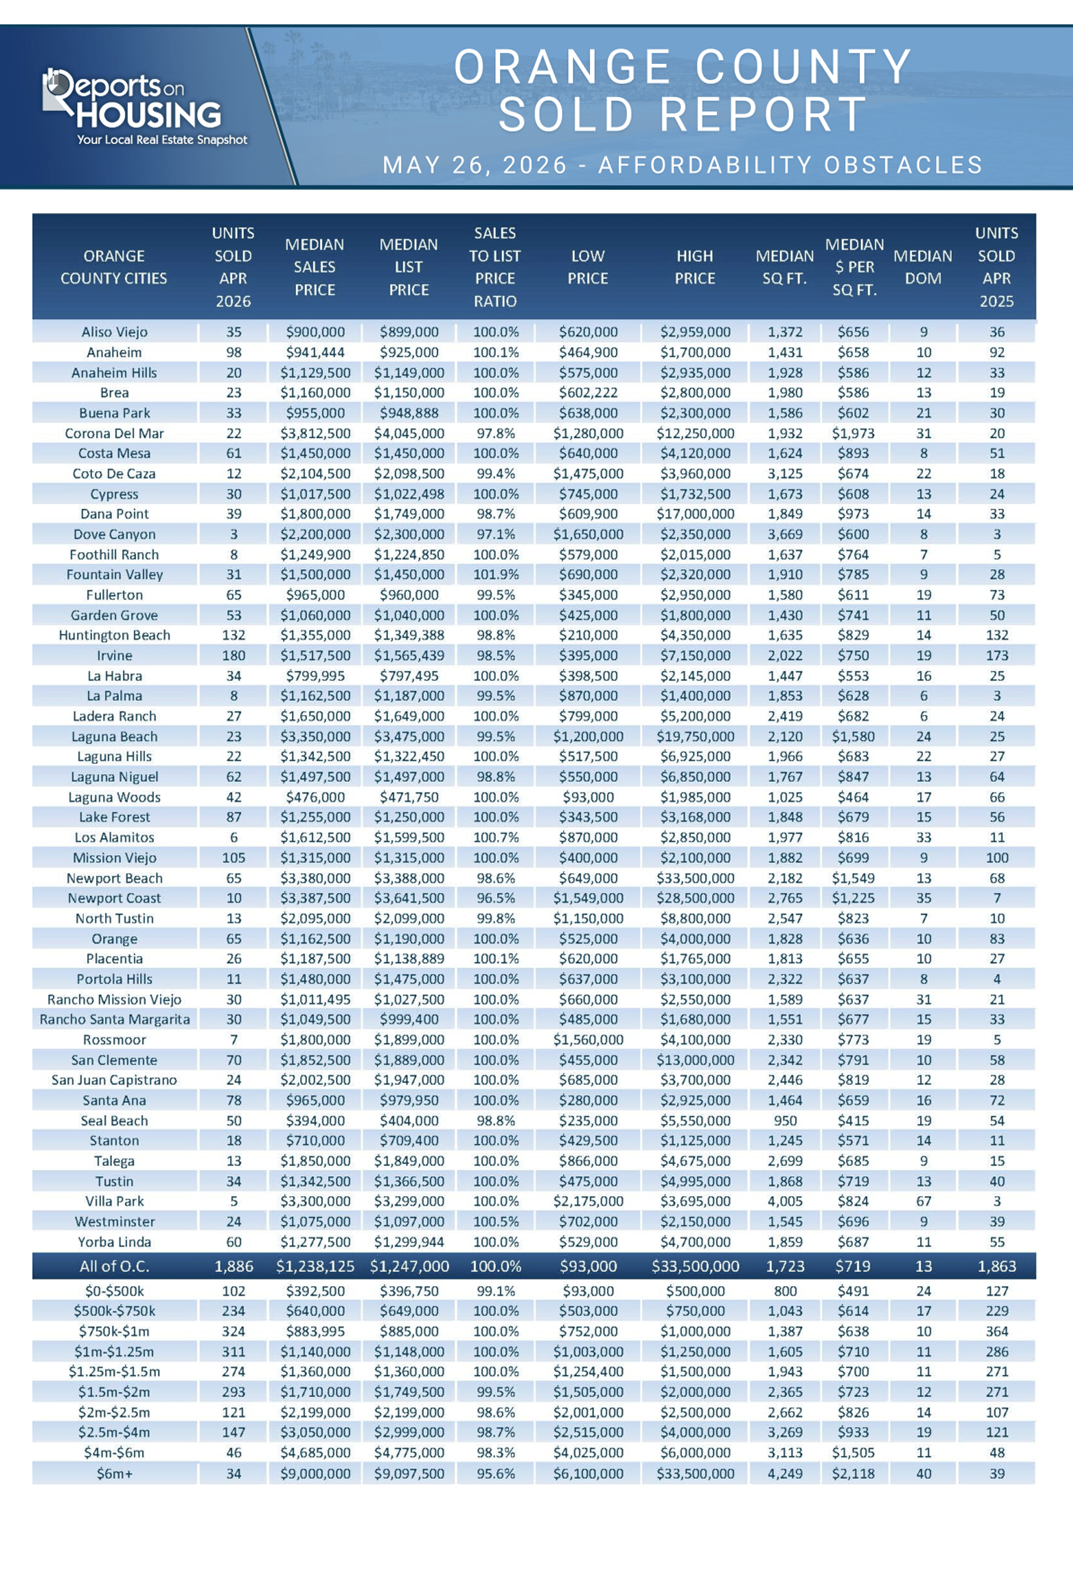
- CLOSED SALES: There were 1,886 closed residential resales in April, up 1% compared to April 2025’s 1,863 sales, and up 2% from March 2026. The sales-to-list price ratio in Orange County was 100.0%. There were no foreclosures, and short sales accounted for 0.1% of all closed sales. That means that 99.9% of all sales were sellers with equity.
Have a great week.
Sincerely,
Steven Thomas
Quantitative Economics and Decision Sciences
Copyright 2026—Steven Thomas, Reports On Housing—All Rights Reserved. This report may not be reproduced in whole or in part without express written permission from the author.