April 27, 2026
The speed of the Orange County housing market depends on price, location, and whether a property is attached or detached.
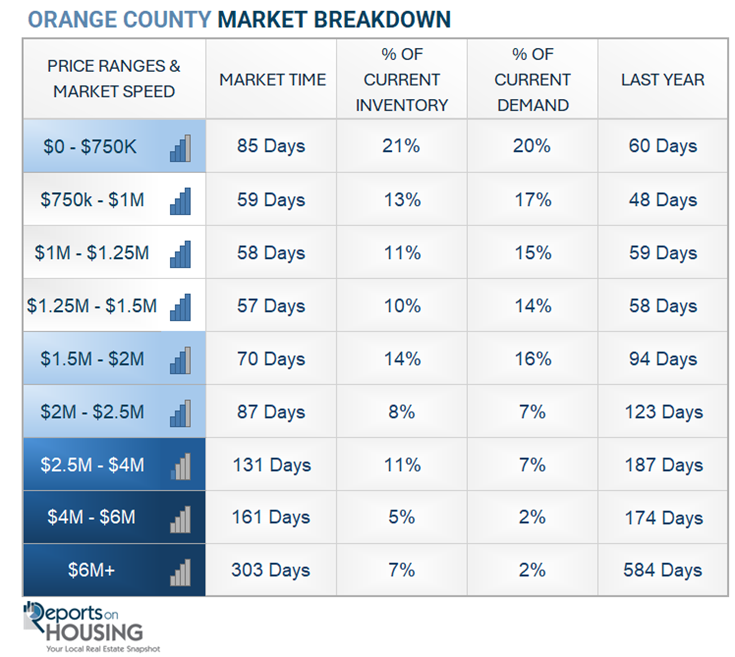
Price Range Differences
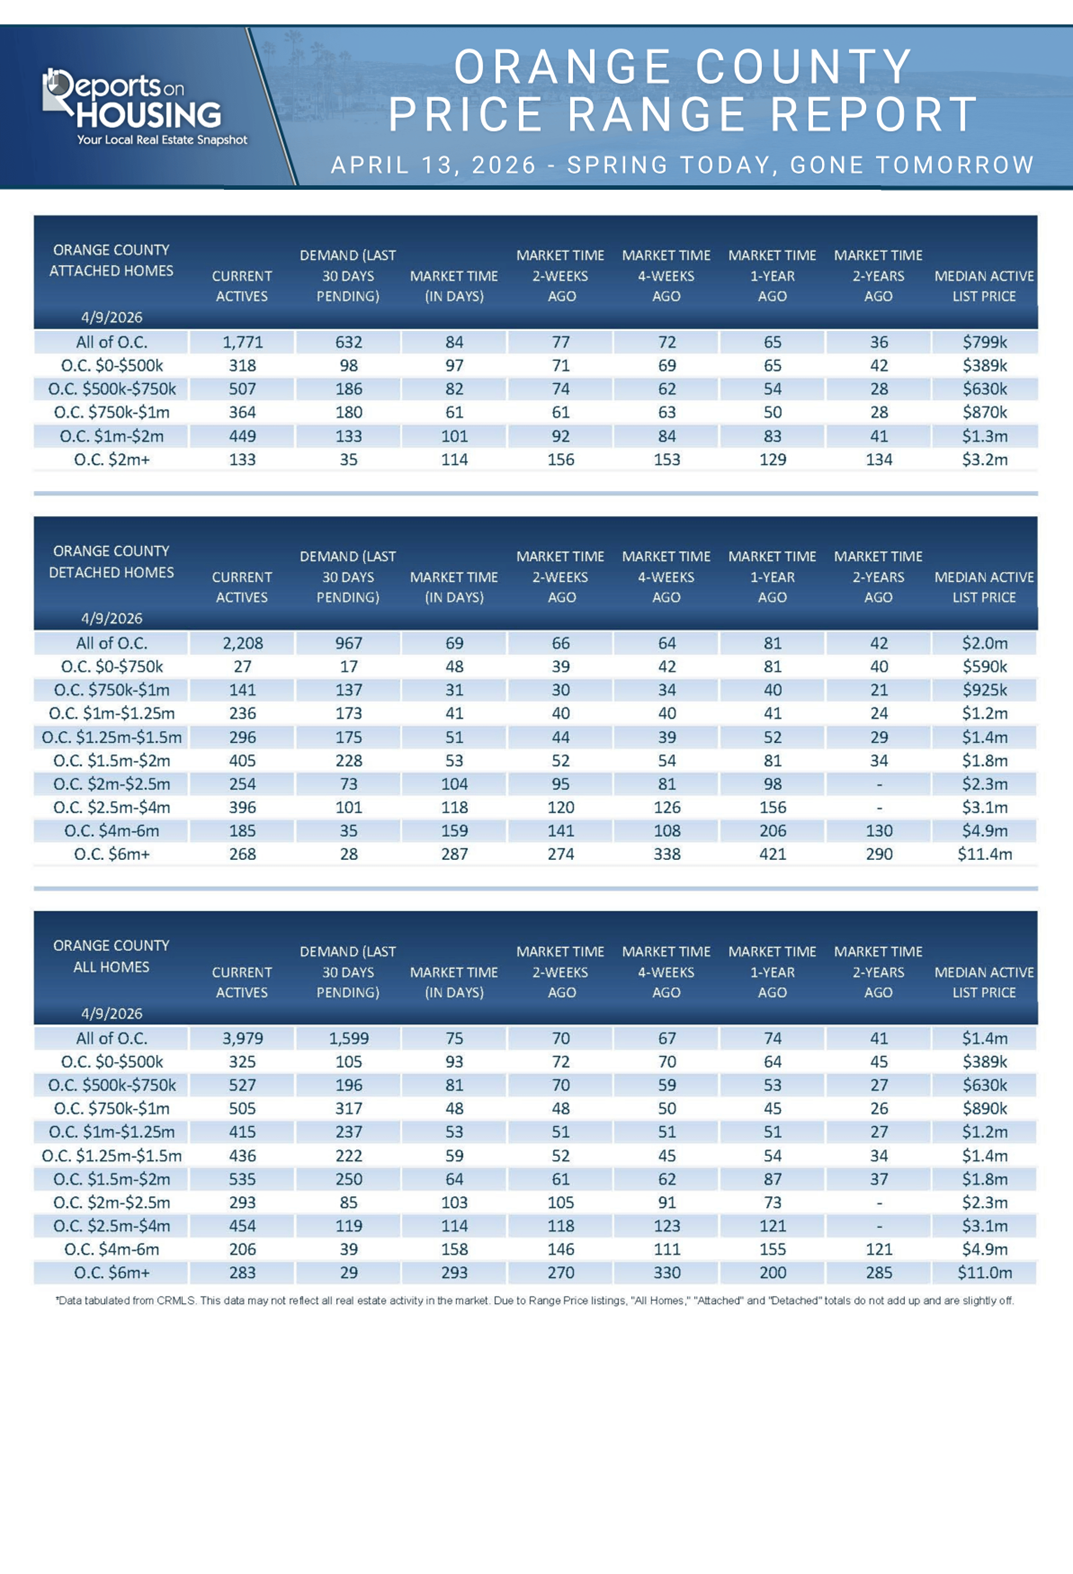
The Expected Market Time ranges from 41 days at its fastest to 297 days at its slowest, depending on the price range.
For anyone who travels, there are days when the airport TSA lines stretch a mile through a maze of rope dividers. Before arriving at the airport, almost everyone grows anxious, anticipating how long it will take to get through security. When the lines wrap around the airport, the anxiety grows. There is more than one line, and some lines are moving much quicker than others. General screening is by far the slowest, with the longest lines and the most patience required. The TSA PreCheck line moves a bit faster, has a much shorter line, and does not require travelers to remove their electronic devices from their bags. It is reserved for travelers who have paid for the service and have had a background check. And now there is an even faster lane, TSA PreCheck Touchless ID, that allows passengers to use facial recognition technology instead of showing a physical ID. The travelers who move through the touchless line seemingly walk through security. TSA anxiety depends on which line a traveler can use.
Similarly, before a seller places their home on the market, almost every homeowner grows anxious, wondering how long it will take to sell. Some price ranges are faster than others. There is a considerable difference in the type of home, detached or attached. A seller’s anxiety depends on the price range and the property type.
A detached home that pops on the market priced at $850,000 will receive plenty of attention and has the best shot in Orange County to fly off the market with multiple offers. With the important caveat that it is not only in great condition but is priced appropriately. Yet a condominium priced at $450,000 takes twice as long as that detached $850,000 home and does not garner the same level of fanfare.
There is a wide spectrum of speeds across the Orange County housing market. It is not one-size-fits-all. The Expected Market Time (the number of days it takes to sell all listings at the current buying pace) for the county, both detached and attached combined, is 80 days. Of course, the market is much hotter in lower price ranges, but the higher the price range, the longer it takes to sell a home. The Expected Market Time is the true “speed” of the market. The speed depends on a home’s price point.
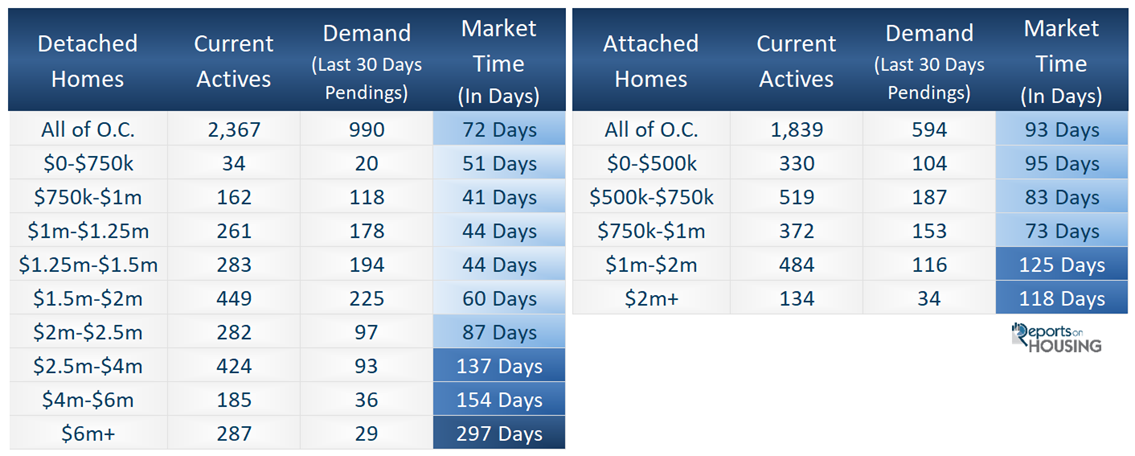
The market is the hottest for detached homes priced between $750,000 and $1.5 million, considered the “sweet spot.” There is more buyer activity in these price points than in the rest of the market, with an Expected Market Time that ranges from 41 to 44 days. Homes within these price ranges that are accurately priced with all the bells and whistles, “WOW” properties, tend to attract multiple offers and often sell at or above their asking prices. For detached homes priced below $750,000 and homes between $1.5 million and $2 million, it is not quite as instant, but still faster than the rest of the market. From there, the market slows.
Luxury homes priced above $2.5 million, the top 10% of the Orange County Market, take the longest to sell. The expectation for these homes is that they will take much longer to sell and require plenty of patience, along with precision pricing. They typically do not fly off the market, and buyers are not tripping over themselves to purchase. The pace is the slowest for homes priced above $6 million, currently stretching 297 days, nearly a year. There are not enough buyers looking for ultra-luxury homes compared to the number of sellers competing against each other.
The attached homes market is considerably slower than the detached market. This is due to rising costs of condominium homeowner associations. Maintenance costs, skyrocketing insurance premiums, and reserve fund issues have resulted in rising monthly association dues and special assessments. In addition, today’s higher mortgage rates have eroded home affordability for condominiums, which many first-time home buyers view as a stepping stone to home ownership. This has translated to longer market times for attached homes. The hottest price range for attached properties is $750,000 to $1 million at 73 days, followed by $500,000 to $750,000 at 83 days. Small, entry-level condominiums priced below $500,000 are sluggish at 95 days. A year ago, it had a market time of 61 days. Similar to detached homes, the higher the price, the longer it takes to sell.
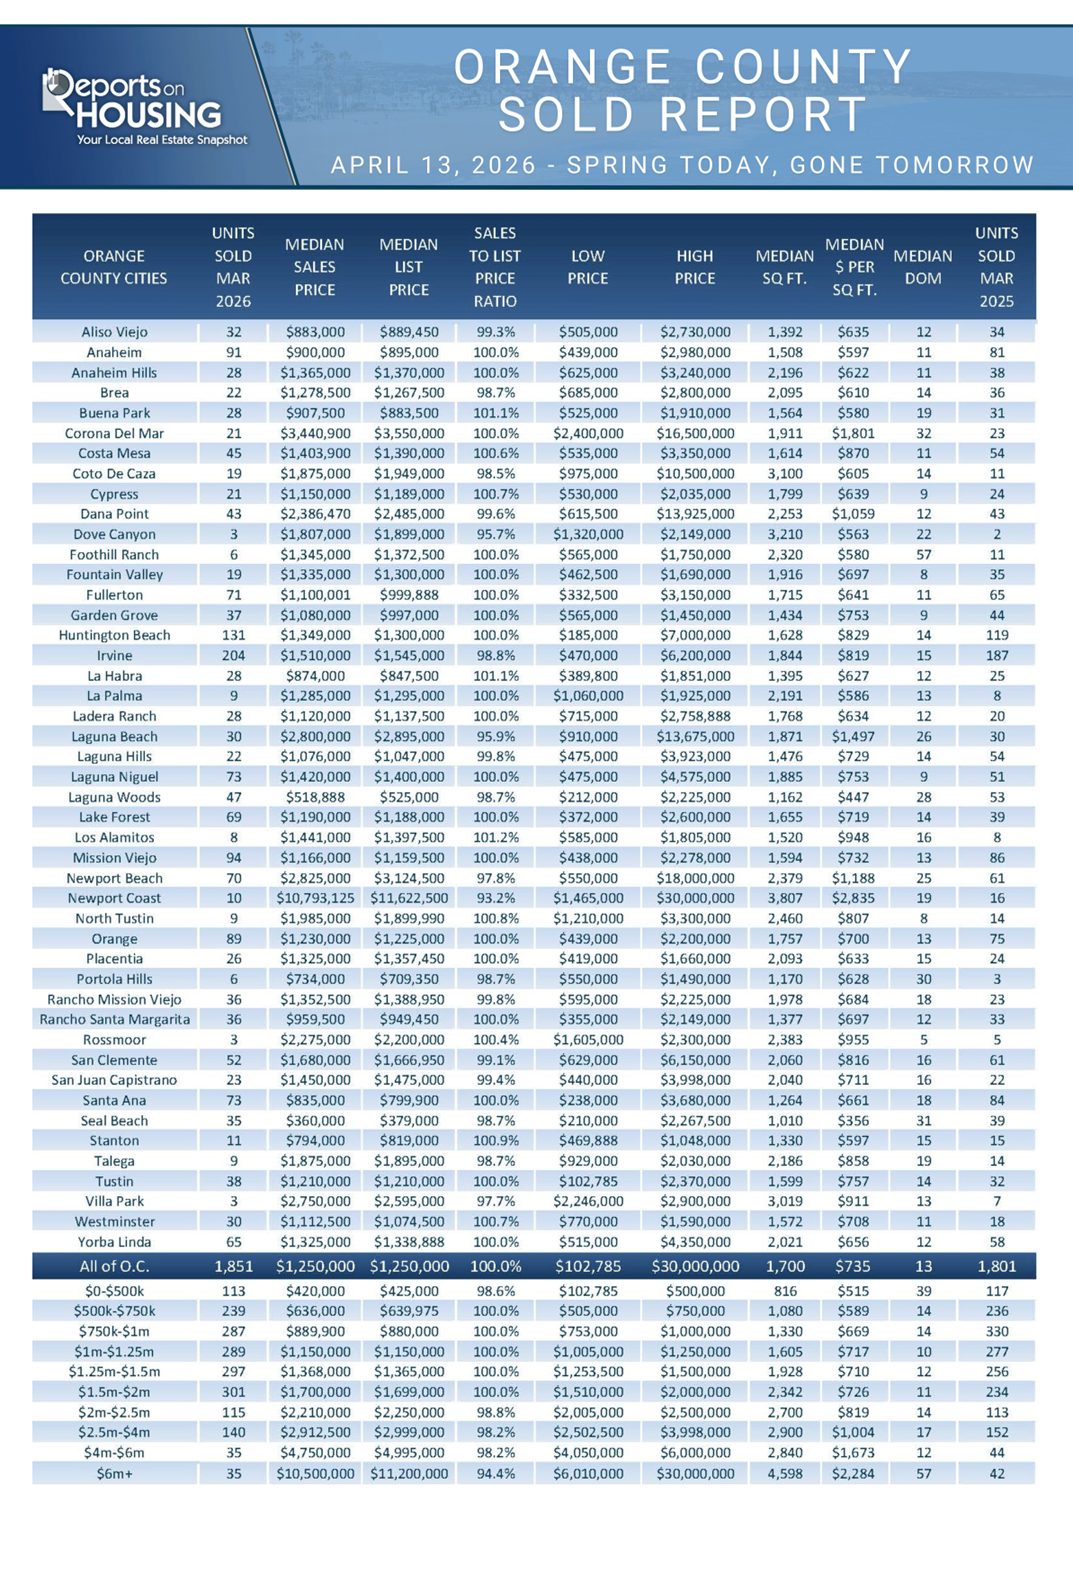
Before coming on the market, homeowners should understand that market speed depends on the price point and whether a home is detached or attached. It also depends on the area. Some cities sell quicker than others for a variety of reasons, including price. Anaheim Hills has a market time of 37 days compared to Rancho Mission Viejo at 104. Most importantly, homeowners need to consider the price carefully. A home that has all the bells and whistles and in turn key condition, yet is overpriced, will languish on the market without success. The best strategy is to price a home based on its Fair Market Value, carefully considering condition, location, upgrades, updates, and amenities, and using all recent comparable closed and pending sales.
The Bottom Line: Orange County housing has a spectrum of speeds that varies by price point, location, and property type. Regardless, price is the most important factor in securing success.
Active Listings
The inventory increased by 6% in the past couple of weeks.
The active listing inventory increased by 227 homes over the past two weeks, up 6%, to 4,206, its largest rise since mid-January. The inventory is increasing at a faster pace as the market dives further into spring. This is the time of year when an elevated number of homes come on the market, outpacing any rise in demand. As a result, seller competition is increasing week by week, and this trend will continue until the inventory reaches a peak between July and August.
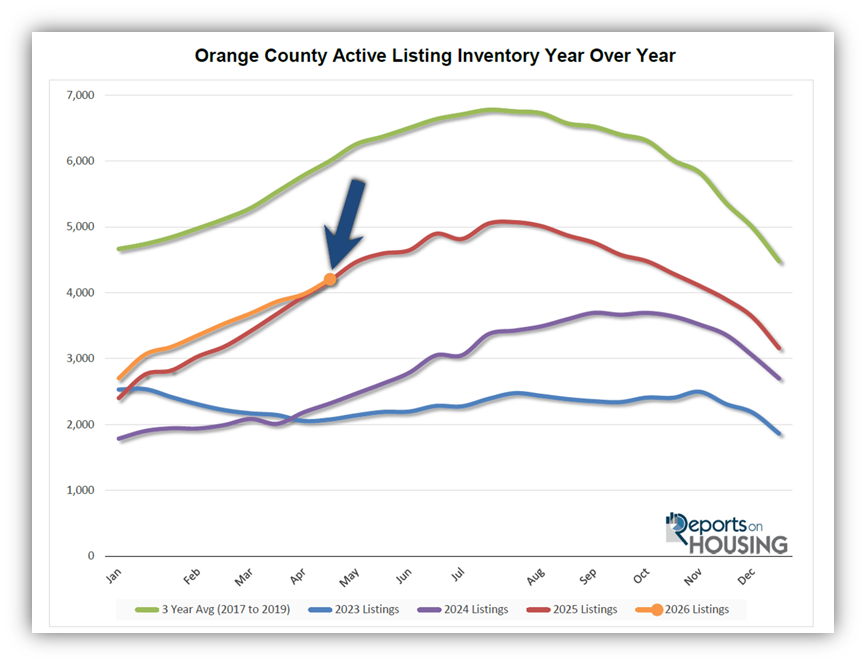
Last year, the inventory was at 4,186 homes, nearly the same as today, with only 20 fewer. The year-over-year gap continued to narrow over the past couple of weeks. The 3-year average before COVID (2017 through 2019) was 6,002, an additional 1,796 homes, or 43% more.
Homeowners continue to “hunker down” in their homes, unwilling to move because of their current, underlying, locked-in, low fixed-rate mortgage. This trend has been easing from the lows established in 2023. Through March, 7,661 homes were placed on the market in Orange County, 2,433 fewer than the 3-year average before COVID (2017-2019), 24% less. In 2025, 7,989 homes entered the market (4% more), compared to 6,480 in 2024 (15% less), and 5,608 in 2023 (27% less). Slightly fewer homes have been coming on the market this year compared to last.
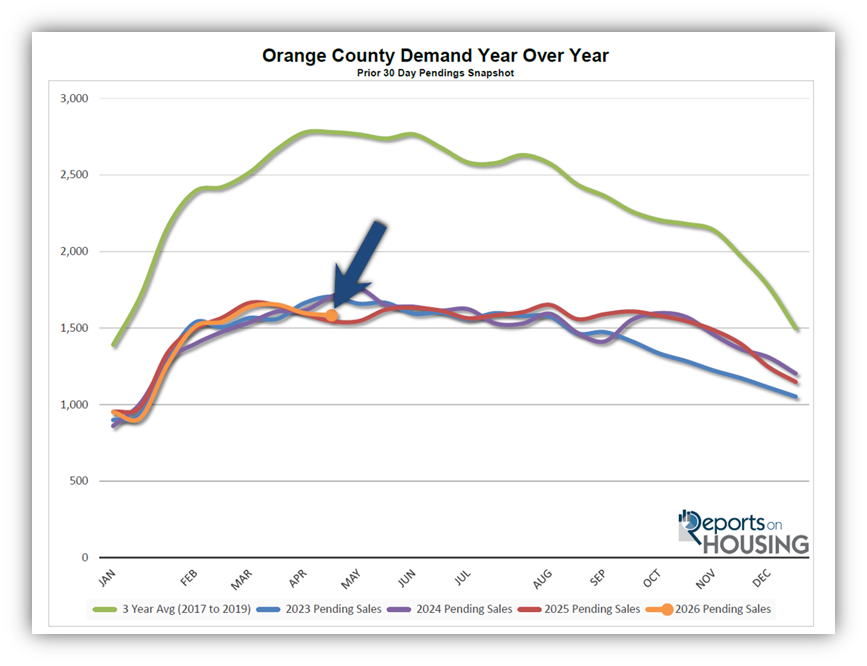
Demand
Demand decreased by 15 pending sales in the past couple of weeks.
Demand, a snapshot of the number of new pending sales over the prior month, decreased from 1,599 to 1,584 in the past couple of weeks, down 15 pending sales, or 1%. Even though demand appears to have peaked in late March, it will remain relatively flat, yet elevated, through September. If the Iran conflict were to end soon and the Strait of Hormuz were to reopen, mortgage rates could fall back towards 6% and even lower with any signs of further labor market weakness.
Last year, demand was 1,546, with 38 fewer pending sales, or 2% lower. The 3-year average before COVID (2017 to 2019) was 2,780 pending sales, 76% more than today, or an additional 1,196.
As the Federal Reserve has indicated, it is essential to watch all economic releases for signs of slowing. These releases can cause mortgage rates to rise or fall, depending on how they compare with market expectations. It is also important to monitor any developments in the Iran conflict and its impact on the oil market, and ultimately inflation, which can also cause mortgage rates to rise or fall. This week, the Federal Reserve meets and will conduct a press conference to announce its decision on the Federal Funds rate. The Personal Consumption Expenditures – Price Index (PCE), the Fed’s preferred inflation gauge, will be released on Thursday. Next week is jobs week, which includes the number of job openings, wages, and the number of jobs created or lost, one of the month’s most important economic data points.
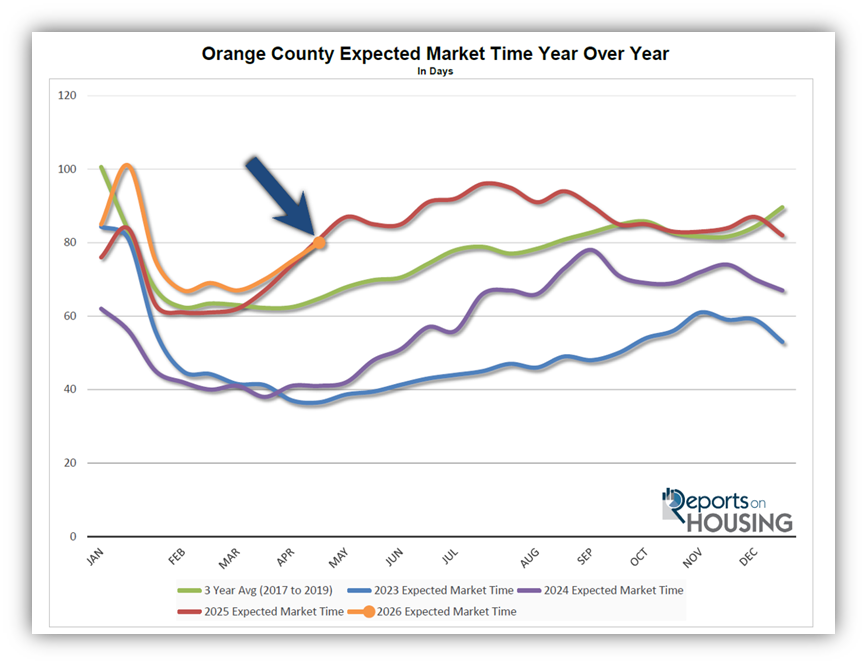
Expected Market Time
In the past two weeks, the market time has increased by five days.
With the supply of available homes rising by 227 homes, up 6%, and demand falling by 15 pending sales, down 1%, the Expected Market Time (the number of days it takes to sell all Orange County listings at the current buying pace) increased from 75 to 80 days in the past couple of weeks. It was 70 days, 4 weeks ago.
Last year, it was 81 days, similar to today. It is the first time the Expected Market Time has been lower than one year ago since March 2024. The 3-year average before COVID (2017 to 2019) was 65 days, quicker than today. The Expected Market Time for condominiums and townhomes increased from 84 to 93 days in the past two weeks. It was 77 days last year. For detached homes, the Expected Market Time increased from 69 to 72 days. It was 84 days a year ago. The detached-home market is faster than the attached-home market.
Luxury End
The luxury market slowed over the past couple of weeks.
In the past couple of weeks, the luxury inventory of homes priced above $2.5 million (the top 10% of the Orange County housing market) increased from 943 to 995 homes, up 52 or 6%. Luxury demand decreased by seven pending sales, down 4%, to 180. With supply rising and demand falling, the Expected Market Time for luxury homes priced above $2 million increased from 151 to 166 days. Like the rest of the market, the luxury market is slowing from week to week and will continue to do so until peaking sometime during the summer.
Year over year, the active luxury inventory is down by 147 homes (-13%), and luxury demand is up by 30 pending sales (+20%). Last year’s Expected Market Time was 228 days, slower than today.
In the past two weeks, the Expected Market Time for homes priced between $2.5 million and $4 million increased from 114 to 131 days. For homes priced between $4 million and $6 million, the Expected Market Time increased from 158 to 161 days. For homes priced above $6 million, the Expected Market Time increased from 293 to 303 days. Luxury is at 166 days overall. At this pace, a seller would be looking at becoming a pending sale around October 2026.
Orange County Housing Summary
- INVENTORY: The active listing inventory in the past couple of weeks increased by 227 homes, up 6%, and now stands at 4,206. Last year, there were 4,186 homes on the market, 20 fewer homes, or nearly identical to today. The 3-year average before COVID (2017 to 2019) was 6,002, which is 43% higher. From January through March, 24% fewer homes came on the market than the 3-year average before COVID (2017 to 2019), 2,433 fewer. There were 328 fewer than last year, 1,181 more than in 2024, and 2,053 more than in 2023.
- DEMAND: Buyer demand, the number of pending sales over the prior month, decreased by 15 in the past two weeks, down 1%, and now stands at 1,584. Demand peaked four weeks ago. Last year, there were 1,546 pending sales, 2% fewer. The 3-year average before COVID (2017 to 2019) was 2,780, which is 76% higher.
- MARKET TIME: With supply increasing and demand falling slightly, the Expected Market Time, the number of days to sell all Orange County listings at the current buying pace, increased from 75 to 80 days in the past couple of weeks, its highest reading since 101 days in mid-January. Last year, it was 81 days, similar to today. The 3-year average before COVID (2017-2019) was 65 days, quicker than today.
- LUXURY: In the past two weeks, the Expected Market Time for homes priced between $2.5 million and $4 million increased from 114 to 131 days. For homes priced between $4 million and $6 million, the Expected Market Time increased from 158 to 161 days. For homes priced above $6 million, the Expected Market Time increased from 293 to 303 days.
- DISTRESSED HOMES: Short sales and foreclosures combined, comprised only 0.3% of all listings and 0.3% of demand. Six foreclosures and six short sales are available today in Orange County, bringing the total of distressed homes on the active market to 12, up two from 2 weeks ago. Last year, nine distressed homes were on the market, similar to today.
- CLOSED SALES: There were 1,851 closed residential resales in March, up 3% compared to March 2025’s 1,801 sales, and up 36% from February 2026. The sales-to-list price ratio in Orange County was 100.0%. Foreclosures accounted for 0.1% of all closed sales, and there were no short sales. That means that 99.9% of all sales were sellers with equity.
Have a great week.
Sincerely,
Steven Thomas
Quantitative Economics and Decision Sciences
Copyright 2026—Steven Thomas, Reports On Housing—All Rights Reserved. This report may not be reproduced in whole or in part without express written permission from the author.