March 2, 2026
Mortgage rates are substantially lower compared to a year ago, and there are more homes available to purchase, making this a much more favorable time to be a buyer.
Stronger Stats for Buyers
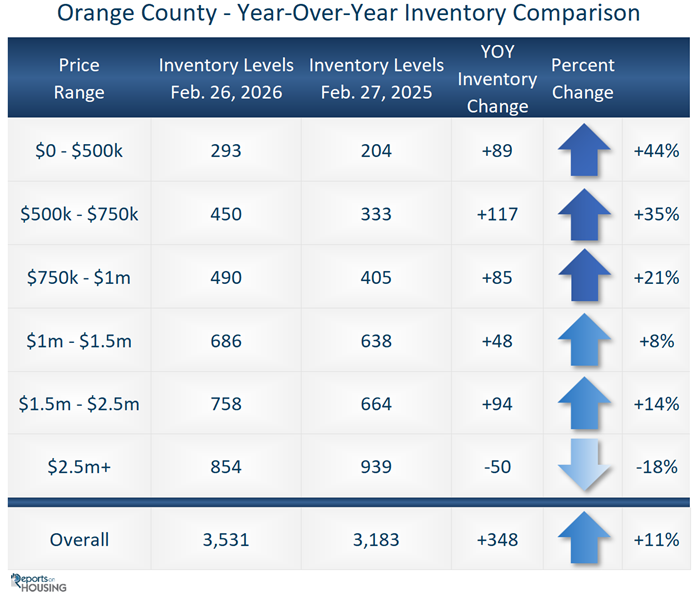
In Orange County, the number of homes available for under $1.5 million is up 21% compared to one year ago.
The Southern California coastline is stunning. Its rolling sets of crashing waves beckon beachgoers to splash in the surf. For first-timers ready to jump in the water after basking in the sun, they are unexpectedly greeted by a very cold Pacific Ocean, where temperatures average the mid-50s during the winter and the upper 60s in late summer. Occasionally, when all the stars align, the water is perfect, reaching the mid-70s.
In recent years, the housing market has felt very cold and unwelcoming for buyers. The supply of available homes, especially in the lower price ranges, had been especially limited, and mortgage rates had been stuck between 6.5% and 7.5% since September 2022. Yet, the conditions have been changing. For buyers new to the market, as they test the waters and dip their toes into the housing arena, they are finding the stars are finally beginning to align. There are more homes available in the more affordable price points, and mortgage rates have dropped to 6%.
Digging deeper into the numbers, there are a total of 3,531 homes available in Orange County. That’s up 11%, or 348 homes, compared to last year’s 3,183. The increase is not coming from luxury, above $2.5 million. In fact, luxury is down 18% or 50 homes compared to a year ago. The rest of the market, homes under $2.5 million, there are 2,677 today compared to 2,244 last year, up 433 or 19%. The lowest price points have grown the most, an excellent development for entry-level, first-time buyers. The supply of properties below $500,000 is up 89 or 44%. From $500,000 to $750,000, it is up 117 or 35%, and from $750,000 to $1 million, it is up 85 or 21%.
Inventory levels have been limited for years, and the extra homes are a welcome relief to the chronically low supply. In 2024, there were 1,992 available homes, 44% fewer than today. In 2023, there were 2,218, 37% fewer, and in 2022, there were 1,406, 60% less. Today’s 3,531 is the highest end-of-February reading since 2020’s 4,161 homes, 18% more than today.
Mortgage rates had been stuck between 6.5% to 7.5% ever since they spiked above 6.5% in September 2022, three-and-a-half years ago. Occasionally, they would drop slightly below 6.5% or rise above 7.5% for a few days, but for the most part, they were stuck right around 7%. With a weakening labor market in 2025, they dipped below 6.5% on September 3rd and have never looked back. It has now been 6 months, indicating that this new, lower-rate environment is here to stay. Recently, rates have been dancing right at 6%, their lowest levels since September 2022, 41 months ago. With today’s higher property values, affordability remains squeezed, but the year-over-year improvement is eye-opening.
Buyers desirous of a $5,000 per month principal and interest payment with 20% down would have been looking at a $940,000 home last year, when mortgage rates bobbed around 7% (it was last above 7% at the end of May). Today, with mortgage rates right at 6%, that same buyer is looking at a $1,042,500 home, or an additional $102,500 in purchasing power. At the same time, home values have been flat year-over-year, down 0.1% according to the Zillow Home Value Index.
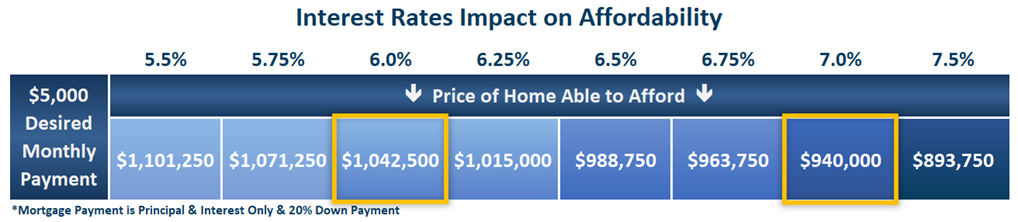
If the U.S. economy were to downshift further in the coming months, mortgage rates could fall further to 5.75%. When the economy cools, investors shift their focus from stock market volatility to the long-term safety of government treasury bonds and mortgage-backed securities. The buyer seeking that $5,000 payment would be looking at a $1,071,250 home.
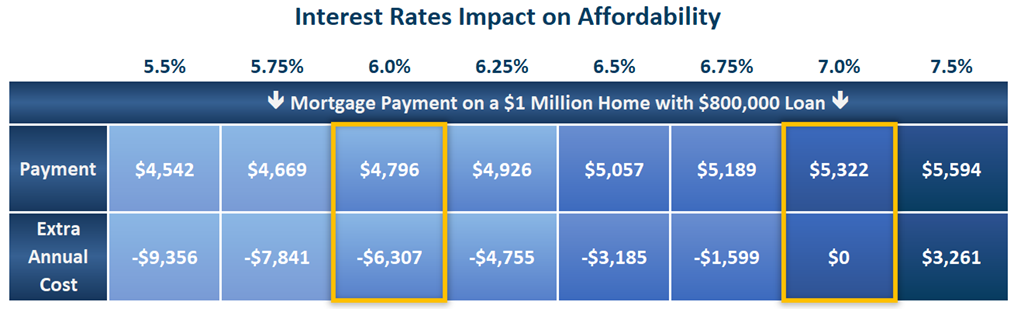
Another way to look at the improvement in affordability is to compare the payment on a specific-priced home as rates drop. For a $1 million home with 20% down, at 7%, the payment is $5,322. The payment drops to $4,796 per month at 6%, a $526-per-month savings, or $6,307 per year.
The market may have appeared frozen over the past few years, with a limited supply and higher mortgage rates, but Orange County housing has been slowly thawing behind the scenes. The buying conditions have improved dramatically with a growing inventory of available homes and a much more favorable mortgage rate environment. For many, it may be time to dip their toes into the water.
Active Listings
The inventory increased by 5% in the past couple of weeks.
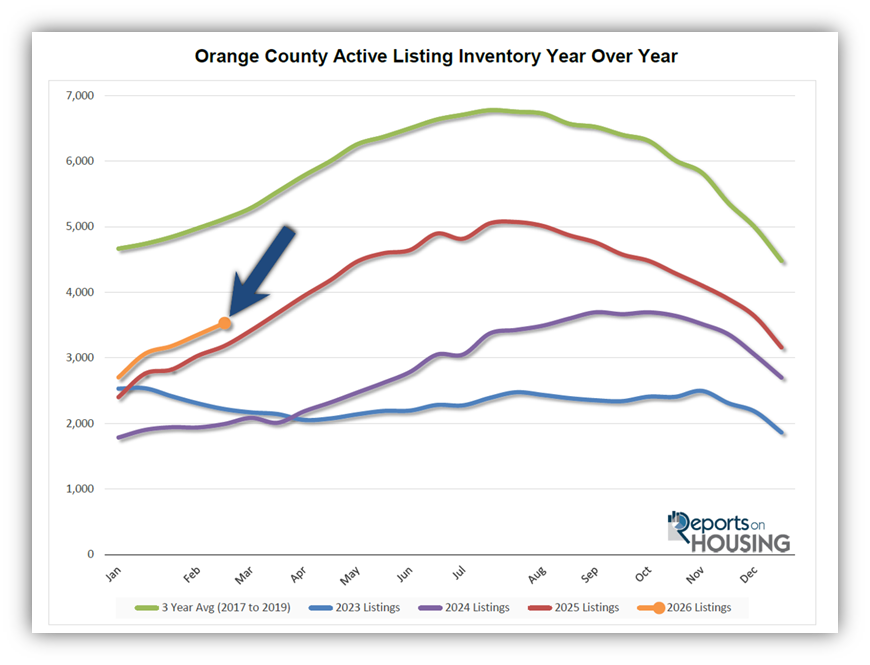
The active listing inventory increased by 177 homes over the past two weeks, up 5%, and now sits at 3,531, its highest end of February level since 2020, when it reached 4,161. The Orange County inventory is following the same trajectory as last year. If this continues, the supply of available homes will slowly but methodically climb until it peaks around the end of July, start of August. The only caveat to that is how demand develops with the improved buying conditions. So far this year, through February, 5% fewer homes have been placed on the market compared to last year, 238 fewer homes. If demand increases and the same number of homes, or slightly fewer, are placed on the market, then the inventory will have trouble growing. That would result in a lower peak than last year.
Last year, the inventory was at 3,183 homes, 10% lower, or 348 fewer. The 3-year average before COVID (2017 through 2019) was 4,982, an additional 1,451 homes, or 41% more.
Homeowners continue to “hunker down” in their homes, unwilling to move because of their current, underlying, locked-in, low fixed-rate mortgage. This trend has been easing from the lows established in 2023. Through February, 4,803 homes were placed on the market in Orange County, 1,383 fewer than the 3-year average before COVID (2017-2019), 22% less. In 2025, 5,041 homes entered the market (5% more), compared to 4,119 in 2024 (14% less), and 3,472 in 2023 (40% less). Slightly fewer homes have been coming on the market this year compared to last.
Demand
Demand increased by only 2% in the past couple of weeks.
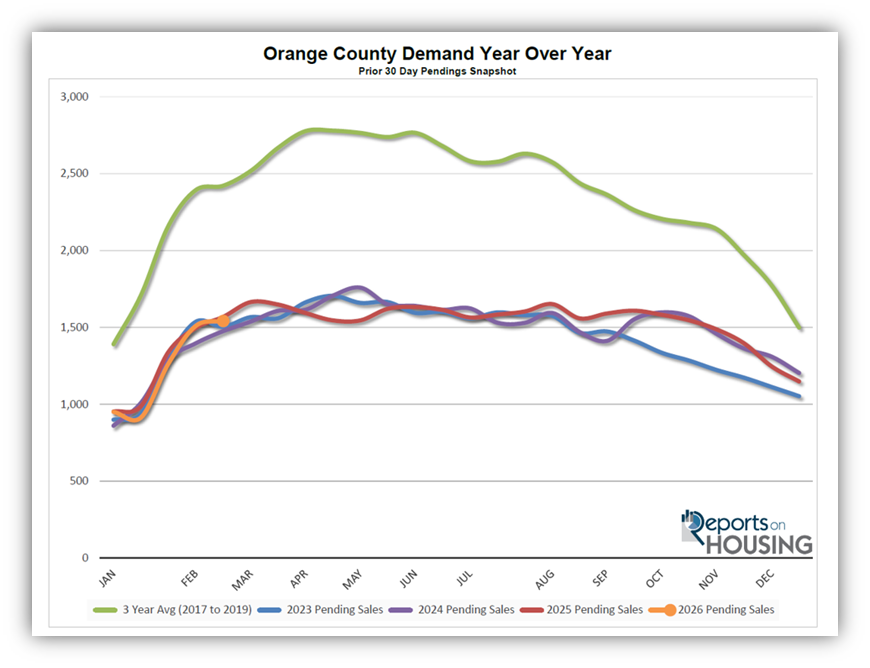
Demand, a snapshot of the number of new pending sales over the prior month, increased from 1,510 to 1,542 in the past couple of weeks, up 32 pending sales, or 2%, the highest level since last October. Despite much-improved buyer conditions and a more favorable mortgage rate environment hovering around 6%, buyer demand has not shown much impact yet. From dystopian AI fears over the past month to geopolitical volatility and uncertainty, some buyers have been holding off on big purchases. There have been other temporary impacts on demand over the years, from the mass adoption of the Internet, to Y2K, to 9-11, to the government pandemic lockdowns, to the implementation of tariffs. Yet, even with the headwinds, year-over-year demand is nearly the same.
Last year, demand was 1,569, with 27 additional pending sales, or 2% more. It was 13 more just two weeks ago. The 3-year average before COVID (2017 to 2019) was 2,424 pending sales, 57% more than today, or an additional 882.
As the Federal Reserve has indicated, it is essential to watch all economic releases for signs of slowing. That is the only path to lower mortgage rates at this time. These releases can cause mortgage rates to rise or fall, depending on how they compare with market expectations. This week is jobs week, which includes wages and the number of jobs created or lost, one of the month’s most important economic data points. Additionally, retail sales will be released on Friday. Next week, the Producer Price Index (PPI) and the Consumer Price Index (CPI) will be released, two crucial inflation indicators. It will be a pivotal two weeks for mortgage rates.
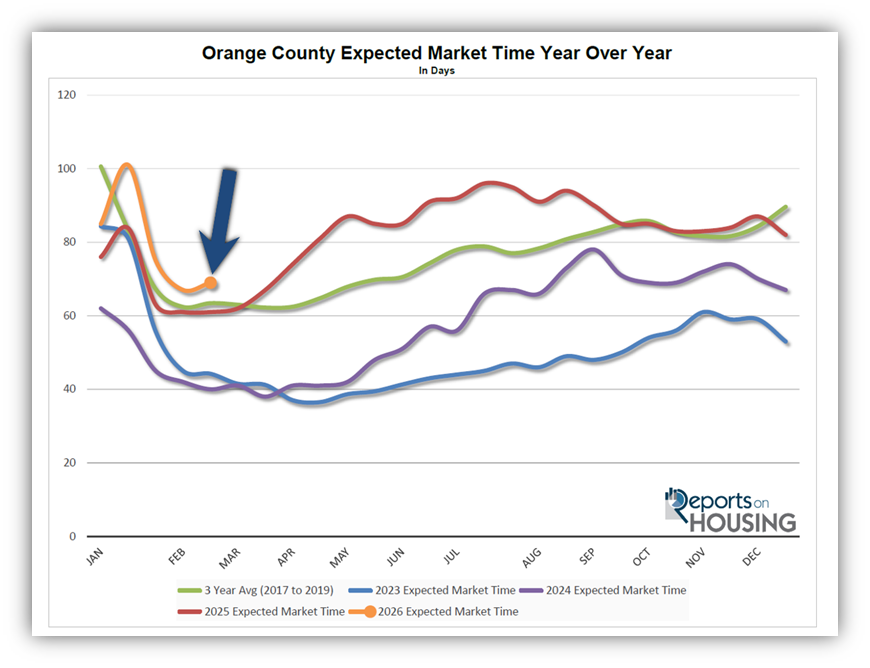
Expected Market Time
In the past two weeks, the market time increased by two days.
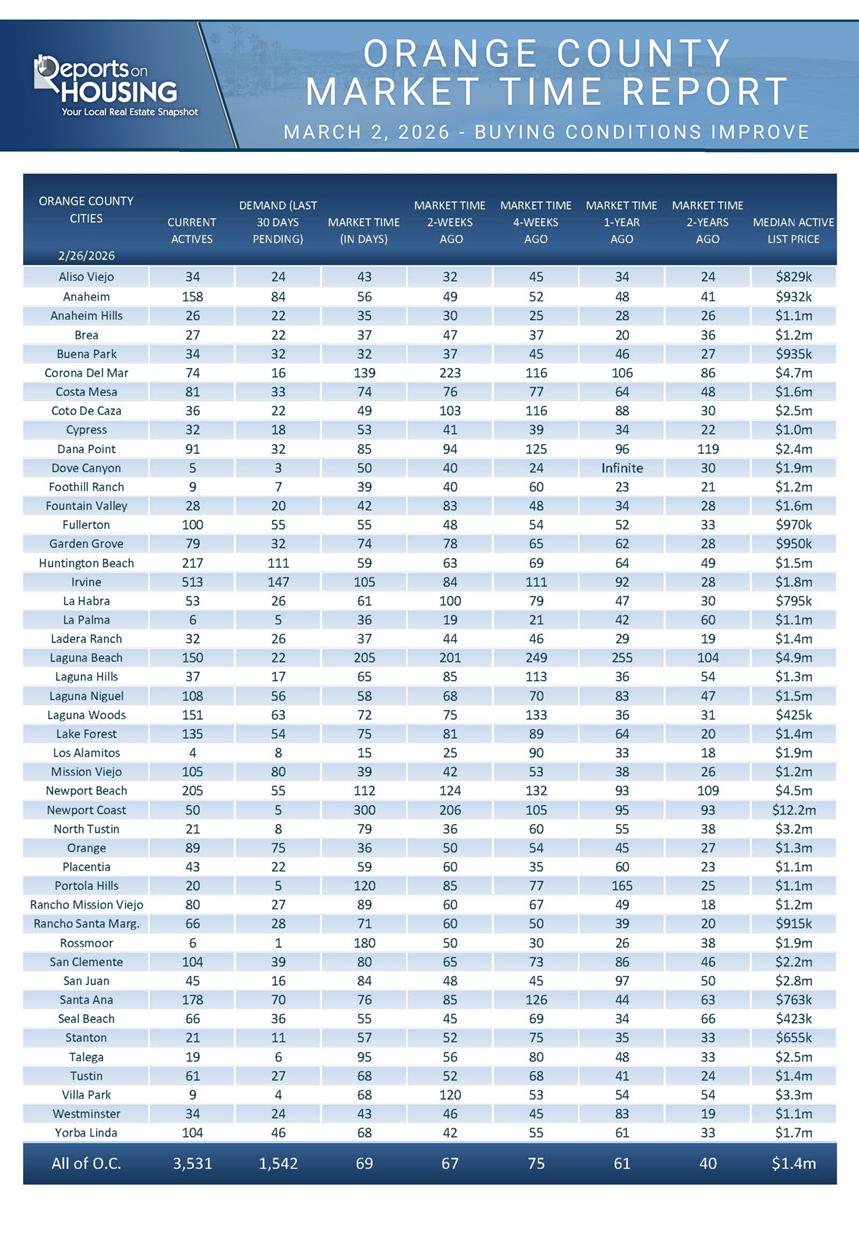
With the supply of available homes rising by 177 homes, up 5%, and demand rising by 32 pending sales, up 2%, the Expected Market Time (the number of days it takes to sell all Orange County listings at the current buying pace) increased from 67 to 69 days in the past couple of weeks.
Last year, it was 61 days, slightly faster than today. The 3-year average before COVID (2017 to 2019) was 62 days, also slightly quicker than today.
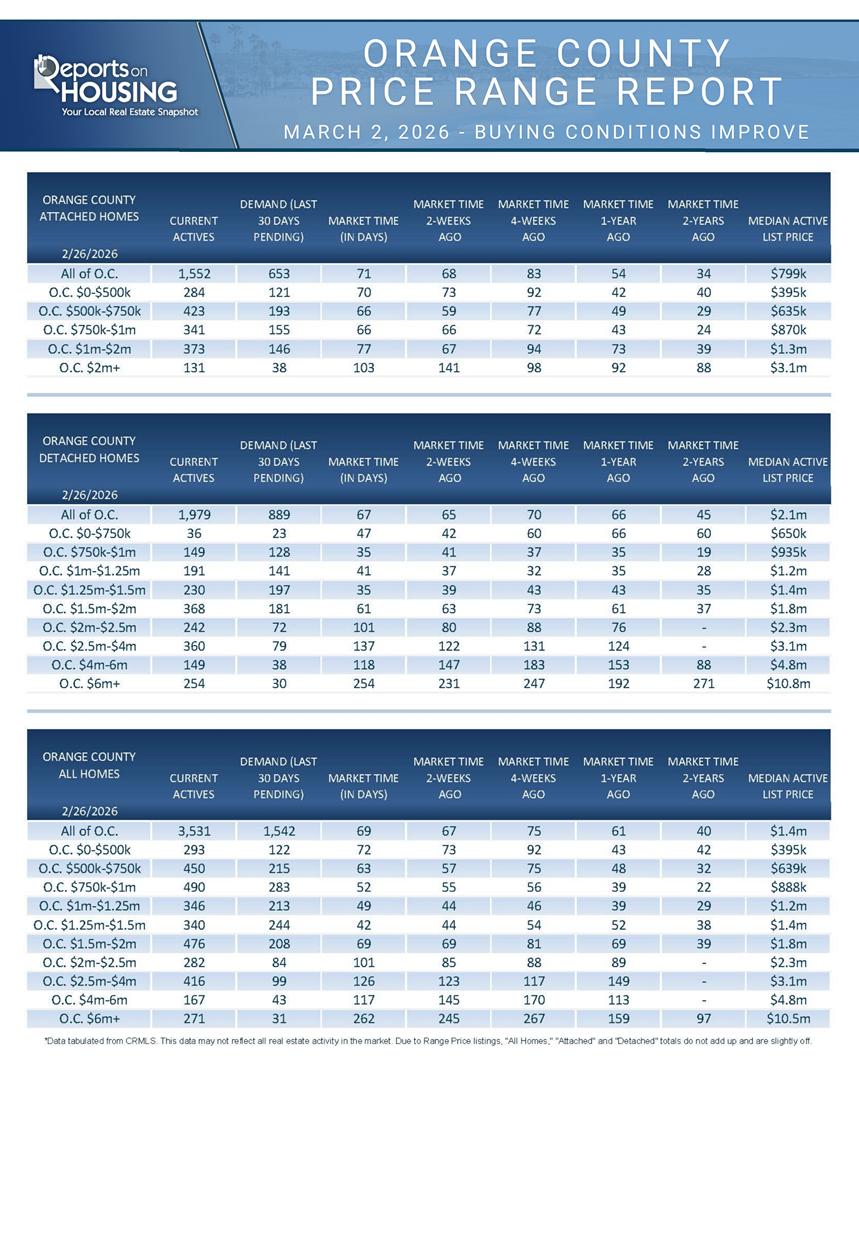
The Expected Market Time for condominiums and townhomes increased from 68 to 71 days in the past two weeks. It was at 54 days last year. For detached homes, the Expected Market Time increased from 65 to 67 days. It was 66 days a year ago, nearly the same as today. The detached-home market is similar to the attached-home market.
Luxury End
The luxury market did not change much over the past couple of weeks.
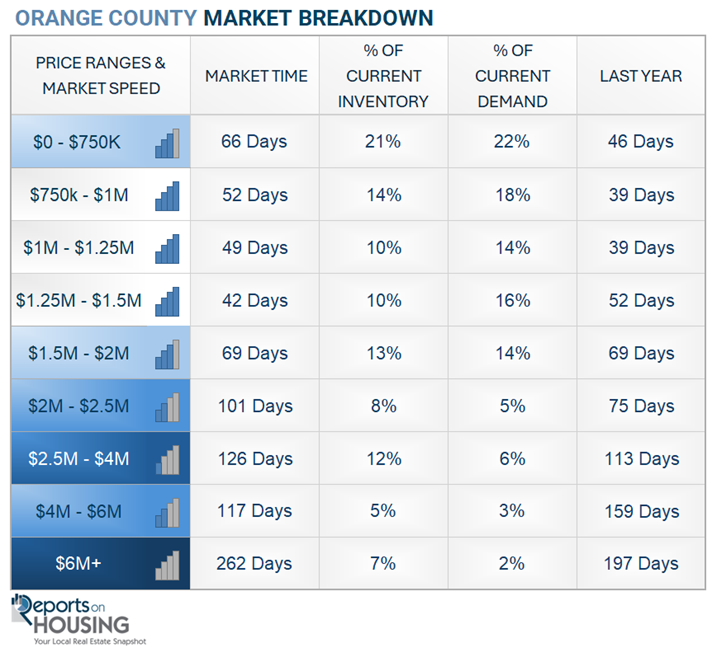
In the past couple of weeks, the luxury inventory of homes priced above $2.5 million (the top 10% of the Orange County housing market) increased from 768 to 854 homes, up 86 or 11%. Luxury demand increased by 20 pending sales, up 13%, to 173, its highest level since November. With demand slightly outpacing supply, the Expected Market Time for luxury homes priced above $2 million decreased from 151 to 148 days, its fastest reading since February of last year. This could be the fastest reading of the year for luxury.
Year over year, the active luxury inventory is down by 85 homes (9%), and luxury demand is down by 27 pending sales (14%). Last year’s Expected Market Time was 141 days, similar to today.
In the past two weeks, the Expected Market Time for homes priced between $2.5 million and $4 million increased from 123 to 126 days. For homes priced between $4 million and $6 million, the Expected Market Time decreased from 145 to 117 days. For homes priced above $6 million, the Expected Market Time increased from 245 to 262 days. Luxury is at 148 days overall. At this pace, a seller would be looking at becoming a pending sale around July 2026.
Orange County Housing Summary
- INVENTORY: The active listing inventory in the past couple of weeks increased by 177 homes, up 5%, and now stands at 3,531. Last year, there were 3,183 homes on the market, 348 fewer homes, or 10% less. The 3-year average before COVID (2017 to 2019) was 4,982, which is 41% higher. From January through February, 22% fewer homes came on the market than the 3-year average before COVID (2017 to 2019), 1,383 fewer. There were 238 fewer than last year, 684 more than in 2024, and 1,331 more than in 2023.
- DEMAND: Buyer demand, the number of pending sales over the prior month, increased by 32 in the past two weeks, up 2%, and now stands at 1,542. Last year, there were 1,569 pending sales, 2% more than today. The 3-year average before COVID (2017 to 2019) was 2,424, which is 57% higher.
- MARKET TIME: With supply increasing faster than demand, the Expected Market Time, the number of days to sell all Orange County listings at the current buying pace, increased from 67 to 69 days in the past couple of weeks. It is the highest end-of-February reading since 2019’s 84 days. Last year, it was 61 days, slightly faster than today. The 3-year average before COVID (2017-2019) was 62 days, also slightly quicker than today.
- LUXURY: In the past two weeks, the Expected Market Time for homes priced between $2.5 million and $4 million increased from 123 to 126 days. For homes priced between $4 million and $6 million, the Expected Market Time decreased from 145 to 117 days. For homes priced above $6 million, the Expected Market Time increased from 245 to 262 days.
- DISTRESSED HOMES: Short sales and foreclosures combined, comprised only 0.1% of all listings and 0.2% of demand. Two foreclosures and two short sales are available today in Orange County, bringing the total of distressed homes on the active market to four, up one from two weeks ago. Last year, five distressed homes were on the market, similar to today.
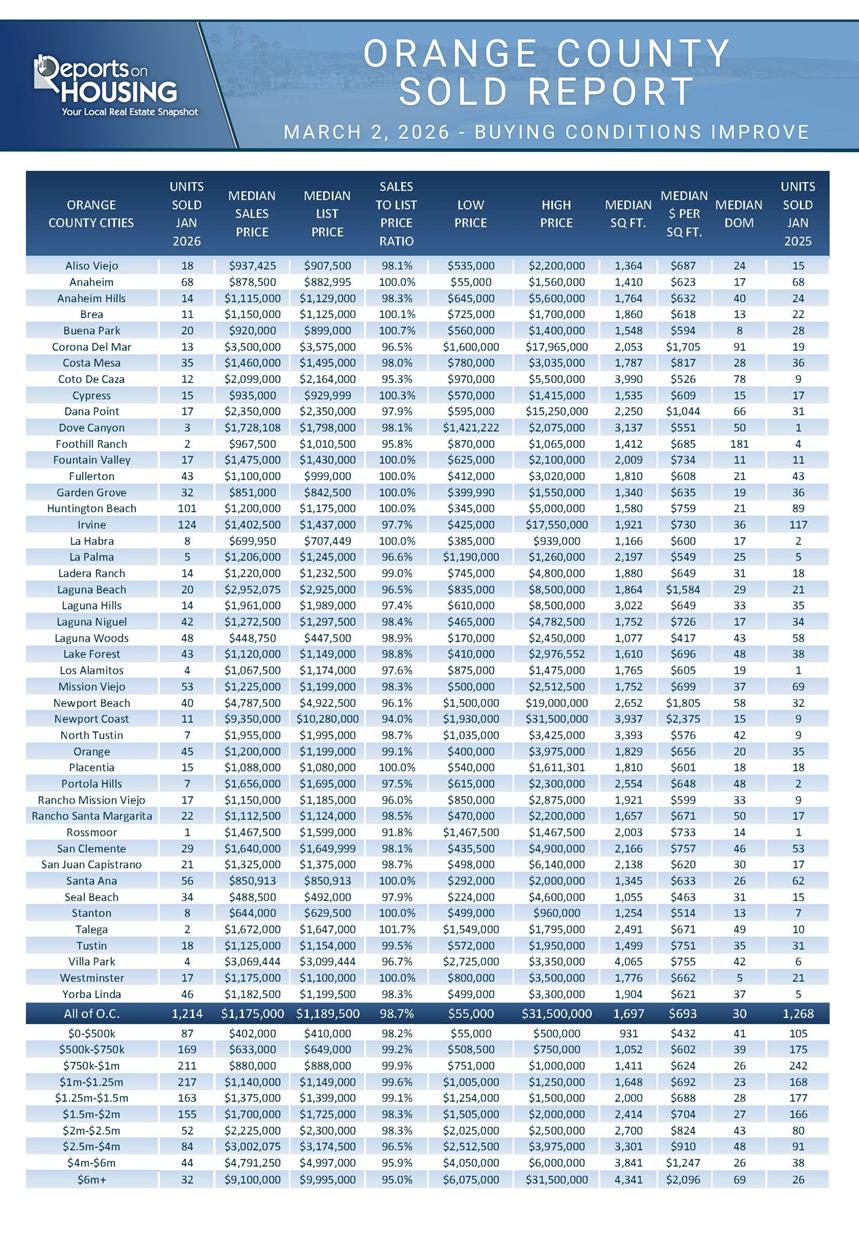
- CLOSED SALES: There were 1,214 closed residential resales in January, down 4% compared to January 2025’s 1,268 sales, and down 26% from December 2025. The sales-to-list price ratio in Orange County was 96.8%. Foreclosures accounted for 0.2% of all closed sales, and short sales accounted for 0.1%. That means that 99.7% of all sales were sellers with equity.
Have a great week.
Sincerely,
Steven Thomas
Quantitative Economics and Decision Sciences
Copyright 2026—Steven Thomas, Reports On Housing—All Rights Reserved. This report may not be reproduced in whole or in part without express written permission from the author.