June 10, 2024
Longer market times and price reductions are very strong indicators that sellers will net less upon closing.
Accurate Pricing is Crucial
Scrutinizing comparable pending and closed sales is critical for sellers to walk away with the most money in the least amount of time.
The housing market has been plagued by a limited inventory for years now. Buyers eagerly await a fresh supply of available homes that best match their wish list. They regularly check their home search apps for anything that hits the market. Home buyers scour every photograph, every feature, and every detail of each home within moments it is listed FOR-SALE. It is during the first week of coming on the market that a home obtains the most attention. Buyers scrutinize the pictures, looking at condition, upgrades, amenities, style, curb appeal, and location. But, even more importantly, before climbing in a car to tour a home, potential purchasers will carefully analyze the asking price.
Correctly pricing a home initially, especially in a market slowing from week to week, is critical to secure a successful outcome and to walk away with as much money as possible. Armed with the knowledge of what they can afford, seasoned buyers have seen many different homes. Some look like a model, and others have plenty of deferred maintenance. They have seen homes that have been upgraded and updated and have alluring amenities. More importantly, they are very familiar with proper pricing for their specific needs. When a home first comes on the market, buyers immediately look at the price in relation to what the house has to offer. They can easily discern when a seller is being a bit overzealous and is stretching the asking price.
Price is ultimately the most critical first impression of a home. Sellers only get one shot at this first impression. After the initial ten days of coming on the market, most seasoned buyers have seen the home. Some decide to tour the house, yet others, after considering all the details, decide that their “phone tour” is enough and they are not interested in pursuing it any further. The longer a home is on the market, the less fanfare and excitement the property receives. Even if a seller reduces the asking price down the road, it is not met with eager buyer anticipation and enthusiasm. Currently, 27% of today’s active listing inventory has reduced the asking price at least once. The data illustrates that lowering the asking price or stubbornly waiting to get a price is not the best strategy.
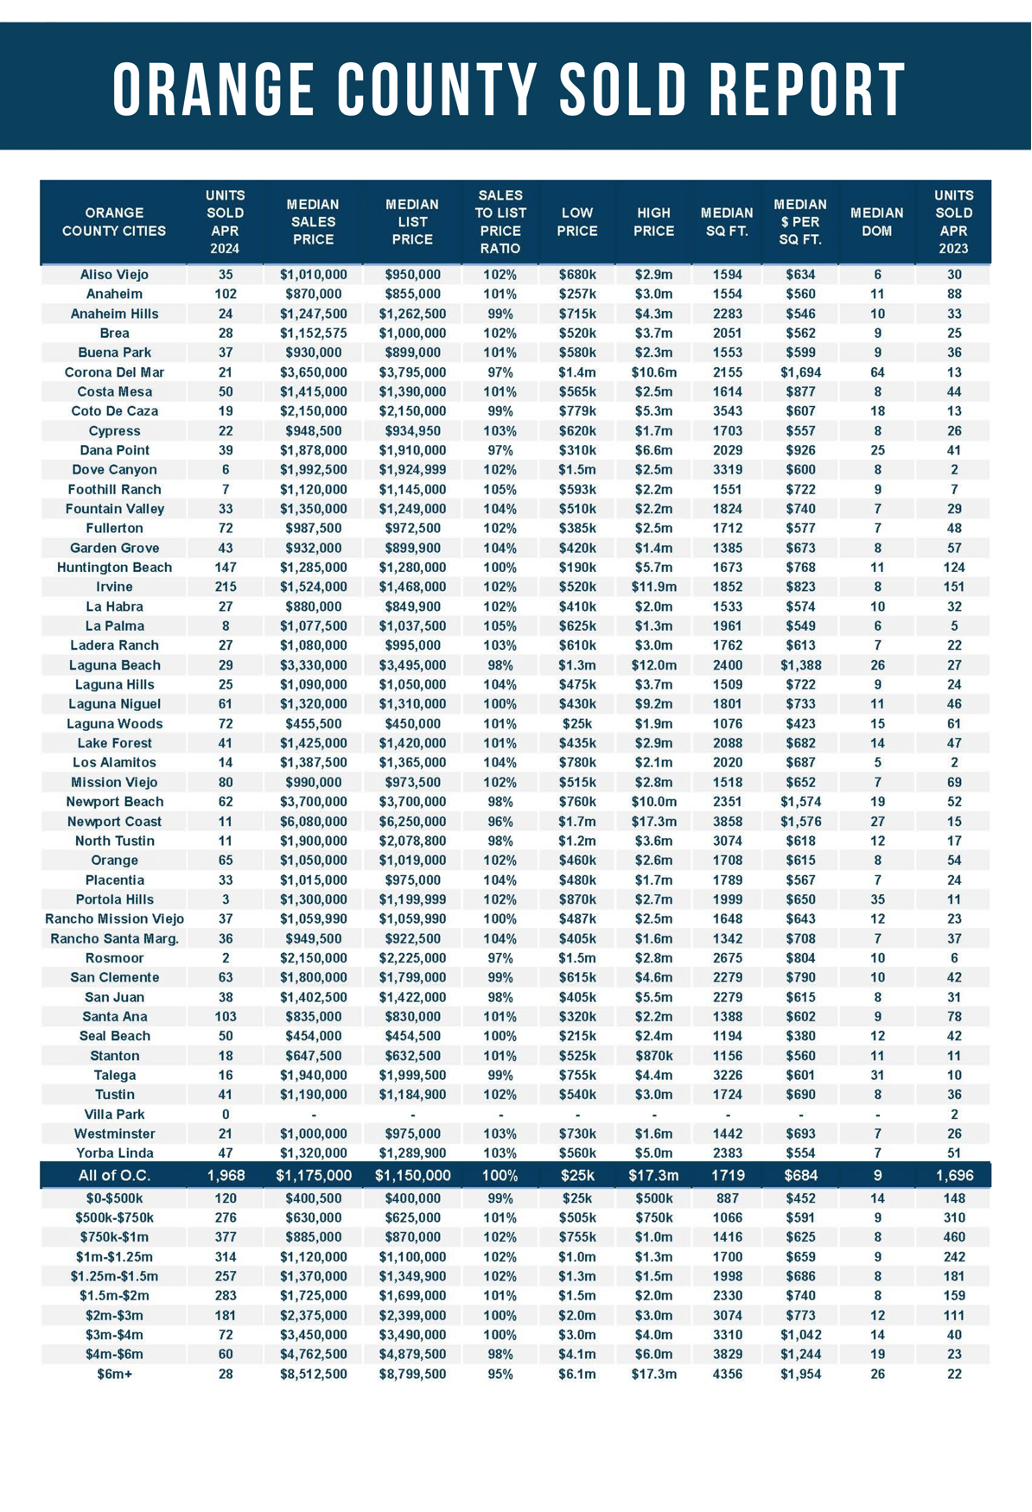
The sales price to last list price ratio is very revealing. This refers to the final list price before becoming a pending sale. These are averages, meaning there are exceptions, but the overall trend is eye-opening. In Orange County, 88% of all closed sales in May did not reduce the asking price. The sales price to last list price ratio for these homes was 101.3%, meaning, on average, a home sold a bit higher than the asking price. A house listed at $1 million sold for $1,013,000, $13,000 above the asking price. The median days on the market before becoming a pending sale was only 8, indicating that accurate pricing means considerably less time on the market in addition to selling, on average, for more than the asking price.
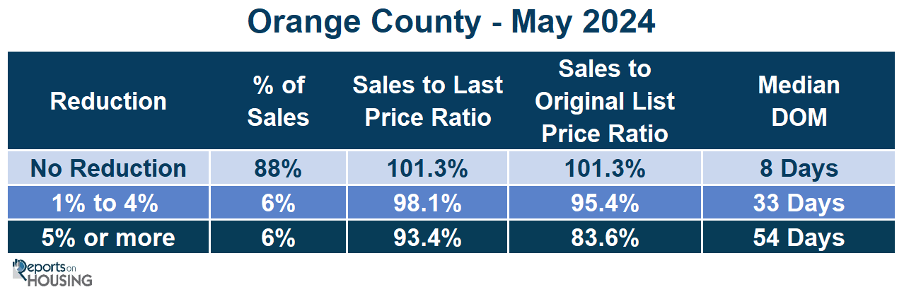
6% of all closed sales reduced their asking prices between 1% and 4%. The sales-to-last list price ratio for these homes was 98.1%; on average, it took 33 days to become a pending sale. A house that reduced its list price to $1 million sold for $981,000, a substantial $32,000 less than homeowners with no reduction.
For homes that reduced their asking prices by 5% or more, 6% of closed sales in May, the sales-to-last list price ratio was 93.4% after being on the market for nearly two months. A home that finally reduced its price to $1 million sold for $934,000. That is a mind-blowing $79,000 less than homeowners who did not need to reduce the asking price.
The sales price to original list price ratio reveals how far off many sellers are in considering a home’s true market value. This is the price of a home when it initially comes on the market before any price reductions. For homes that reduced the asking price between 1% to 4%, the sales price to original list price ratio was 95.4%. For example, a house initially listed at $1,028,000 had to reduce the asking price to $1 million to secure success and ultimately sold for $981,000, an astonishing $47,000 less the original price.
Homes that reduced the asking price by at least 5% had a sales-to-original list price ratio of 83.6%. A house initially listed at $1,117,000 had to lower the asking price, often more than once, to $1 million to find success, and ultimately sold for $934,000. That is an overwhelming $183,000 less than the original asking price.
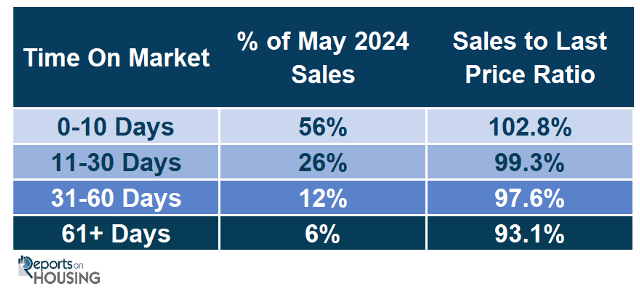
Another surprising statistic is time on the market regardless of whether a seller reduces the asking price. On average, the longer a home is exposed to the market and not a pending sale, the less money a seller walks away with. In Orange County, 56% of all closed sales in May were on the market for ten days or less. The sales-to-last price ratio for these sellers was 102.8%, meaning a home listed at $1 million ultimately sold for $1,028,000, an incredible $28,000 above the asking price. For sellers exposed to the market between 11 and 30 days, 26% of sales, the sales-to-last price ratio was 99.3% – a home listed at $1 million sold for $993,000 or $7,000 below the asking price. For sellers with market times between 31 and 60 days, 12% of sales, the sales-to-last price ratio was 97.6%. That $1 million listing now sells for $976,000 or $24,000 less than the asking price. Finally, for sellers on the market for 61 days or more, 6% of May closed sales, the ratio was 93.1%. The $1 million listed price sold for $931,000, a sizable $69,000 below the asking price.
The most critical step for sellers to secure as much money as possible upon closing is to spend considerable time arriving at a home’s Fair Market Value based on a home’s condition, location, amenities, and location. With mortgage rates stubbornly above 7%, the pressure to initially price a home accurately is the difference between selling quickly and maximizing the net proceeds check after closing versus staying on the market, reducing the asking price, and eventually walking away with less money.
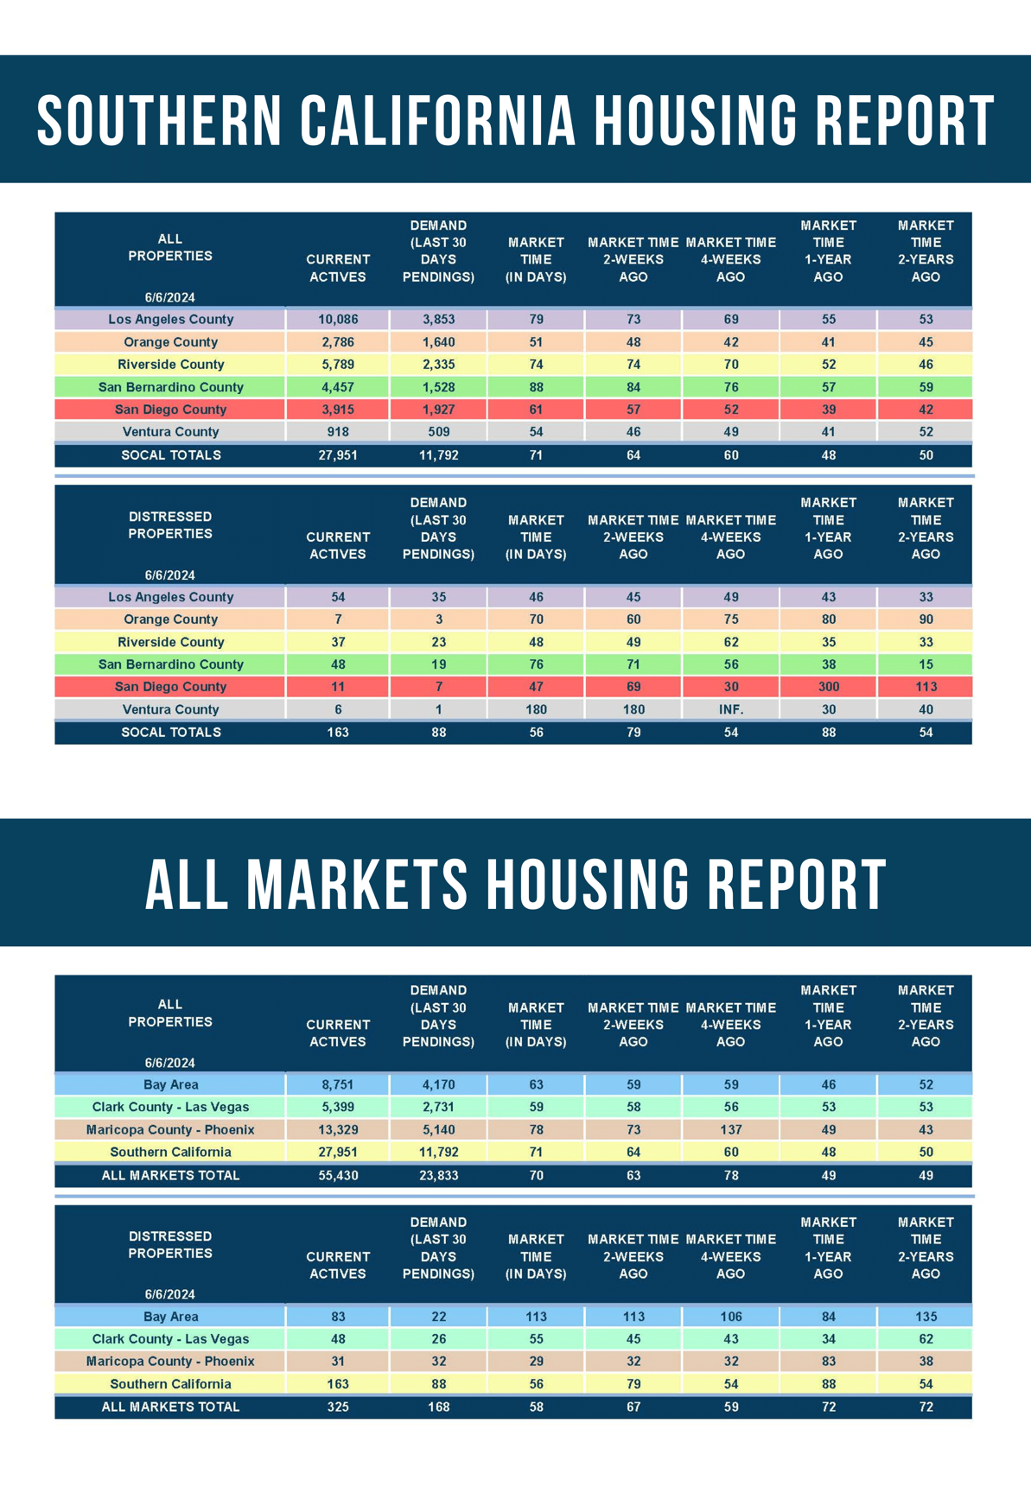
Active Listings
The active inventory climbed by 6% in the past couple of weeks.
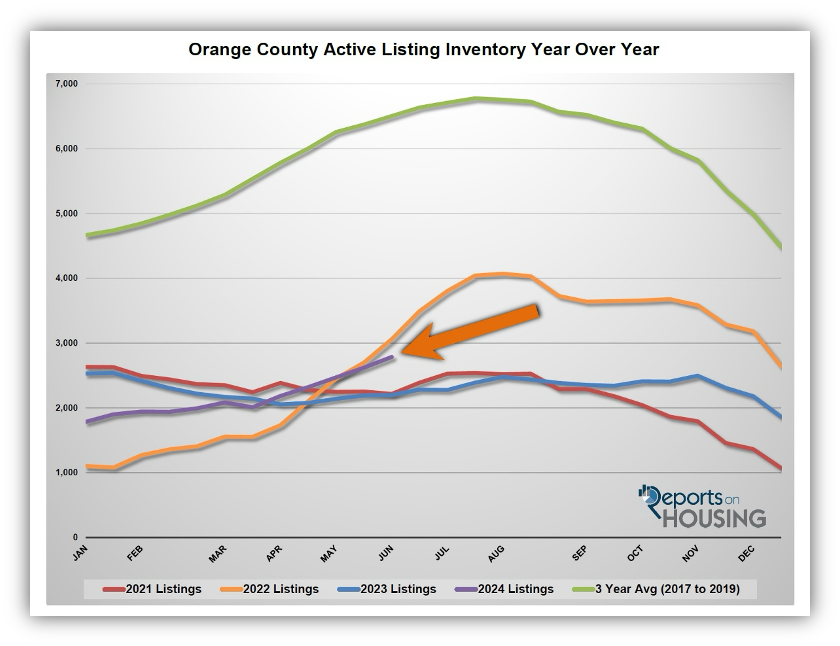
The active listing inventory increased by 166 homes in the past two weeks, up 6%, and now sits at 2,786, its highest level since December 2022. After falling by 74 homes at the end of March, the inventory has grown from 2,010 to 2,786 homes, up 39% or 776. Many homeowners continue to hunker down and are unwilling to move due to their low underlying fixed-rate mortgage. Yet, through May, more homeowners are willing to sell compared to last year, 16% more sellers or an extra 776 FOR-SALE signs. These extra sellers are being matched with demand that is very similar to last year. As a result, the active inventory has been growing as more and more sellers come on the market and compete. Slowly but surely, these sellers are accumulating and competing against each other. The inventory will continue to rise until it peaks between July and August. This accumulation of homes is a welcome relief for buyers looking for a fresh supply.
Last year, the inventory was 2,196 homes, 21% lower, or 590 fewer. The 3-year average before COVID (2017 through 2019) was 6,501, an additional 3,715 homes, or 133% more, more than double the current level.
Homeowners continue to “hunker down” in their homes, unwilling to move due to their current underlying, locked-in, low fixed-rate mortgage. For May, 2,668 new sellers entered the market in Orange County, 1,497 fewer than the 3-year average before COVID (2017 to 2019), 36% less. Last April, there were 2,310 new sellers, 13% fewer than this year. More sellers are opting to sell compared to the previous year.
Demand
Demand dropped by 1% in the past couple of weeks.
Demand, a snapshot of the number of new pending sales over the prior month, decreased from 1,650 to 1,640 in the past couple of weeks, down ten pending sales, or 1%, nearly unchanged. Demand will continue to look similar to last year until mortgage rates drop below 7% with duration. Until then, housing has transitioned to the Summer Market, when the inventory slowly rises and peaks, and demand slowly falls. Last week was jobs week, and everything was going well until the release of May’s job growth on Friday, which was much higher than expected. As a result, rates jumped higher to finish out the week. This week is also crucial for rates. The Federal Reserve meets and will conduct a news conference on Wednesday, ultimately revealing their appetite to cut rates in the future. In addition, the Consumer Price Index will be released on Wednesday, illustrating how quickly inflation is coming down.
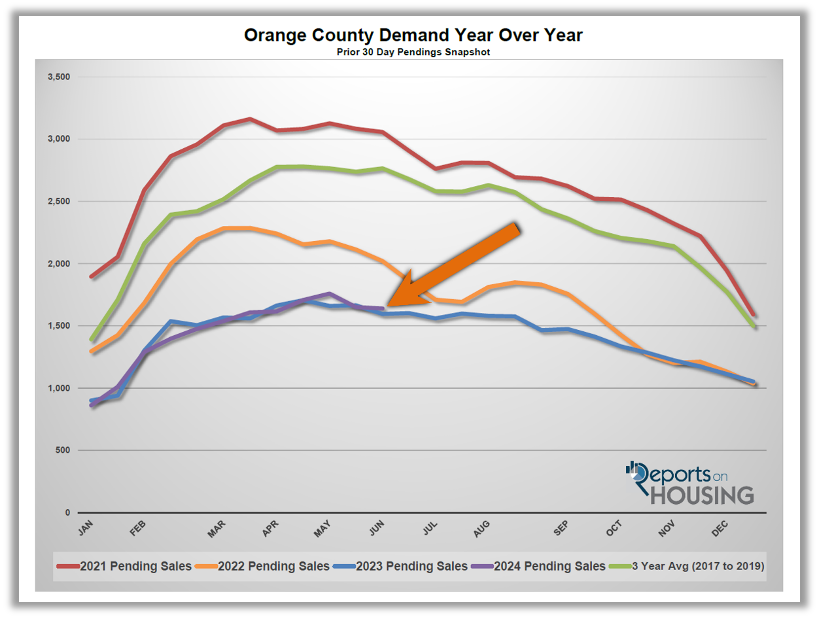
Last year, demand was 1,595, 3% less than today, or 45 fewer pending sales. The 3-year average before COVID (2017 to 2019) was 2,738 pending sales, 69% more than today, or an additional 1,126.
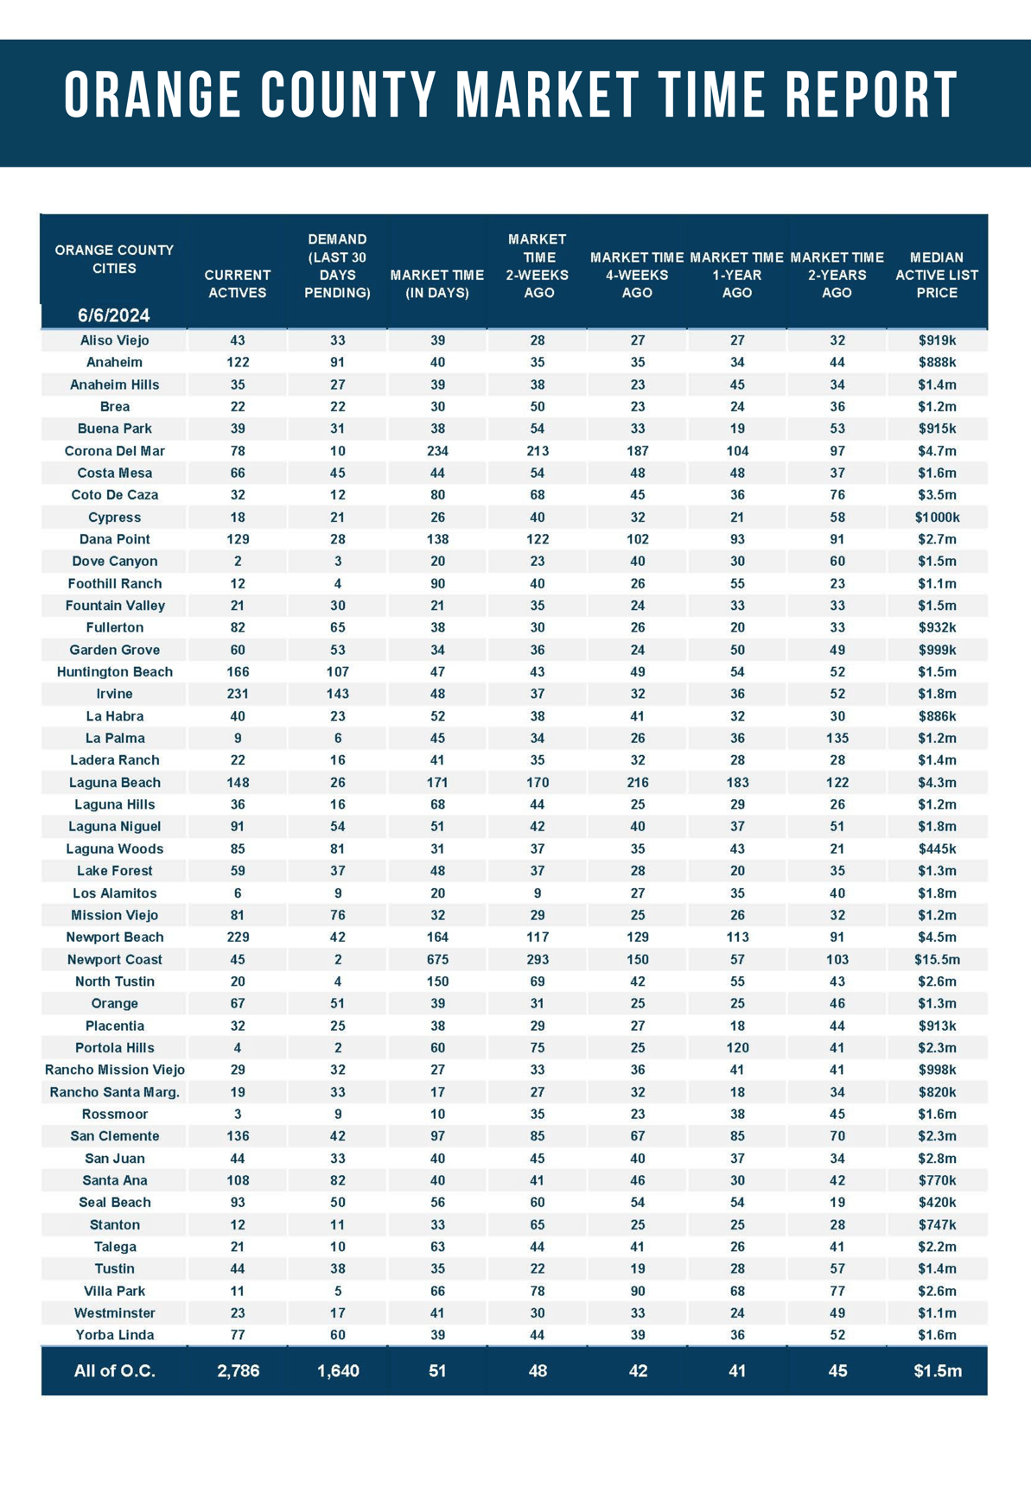
With supply rising and demand falling, the Expected Market Time (the number of days it takes to sell all Orange County listings at the current buying pace) increased from 48 to 51 days in the past couple of weeks, its highest level since January. Last year, it was 41 days, faster than today. The 3-year average before COVID was 71 days, slower than today.
Luxury End
The luxury market cooled in the past couple of weeks.
In the past couple of weeks, the luxury inventory of homes priced above $2 million increased from 971 to 1,018 homes, up 47 or 5%, the highest level since July 2020. Luxury demand decreased by 12 pending sales, down 5%, and now sits at 249. With supply rising and demand falling, the Expected Market Time for luxury homes priced above $2 million increased from 112 to 123 days, its highest level since January. Luxury has slowed since March and the Expected Market Time has grown from 86 to 123 days. For perspective, the lower ranges (less than $2 million) have an Expected Market Time of 38 days. The best approach to today’s luxury market remains careful pricing and plenty of patience.
Year over year, the active luxury inventory is up by 303 homes or 42%, and luxury demand is up by 49 pending sales or 25%. Last year’s Expected Market Time was 107 days, slightly faster than today.
In the past two weeks, the expected market time for homes priced between $2 million and $4 million increased from 76 to 86 days. For homes priced between $4 million and $6 million, the Expected Market Time increased from 154 to 167 days. For homes priced above $6 million, the Expected Market Time increased from 384 to 476 days. At 476 days, a seller would be looking at placing their home into escrow around September 2025.
Orange County Housing Summary
- The active listing inventory in the past couple of weeks increased by 166 homes, up 6%, and now sits at 2,786. In May, 36% fewer homes came on the market compared to the 3-year average before COVID (2017 to 2019), 1,497 less. 358 more sellers came on the market this May compared to May 2023. Last year, there were 2,196 homes on the market, 590 fewer homes, or 21% less. The 3-year average before COVID (2017 to 2019) was 6,501, or 133% extra, more than double.
- Demand, the number of pending sales over the prior month, decreased by ten pending sales in the past two weeks, down 1%, and now totals 1,640. Last year, there were 1,595 pending sales, 3% less. The 3-year average before COVID (2017 to 2019) was 2,766, or 69% more.
- With supply rising and demand falling, the Expected Market Time, the number of days to sell all Orange County listings at the current buying pace, increased from 48 to 51 days in the past couple of weeks. It was 41 days last year, faster than today. The 3-year average before COVID (2017 to 2019) was 71 days, slower than today.
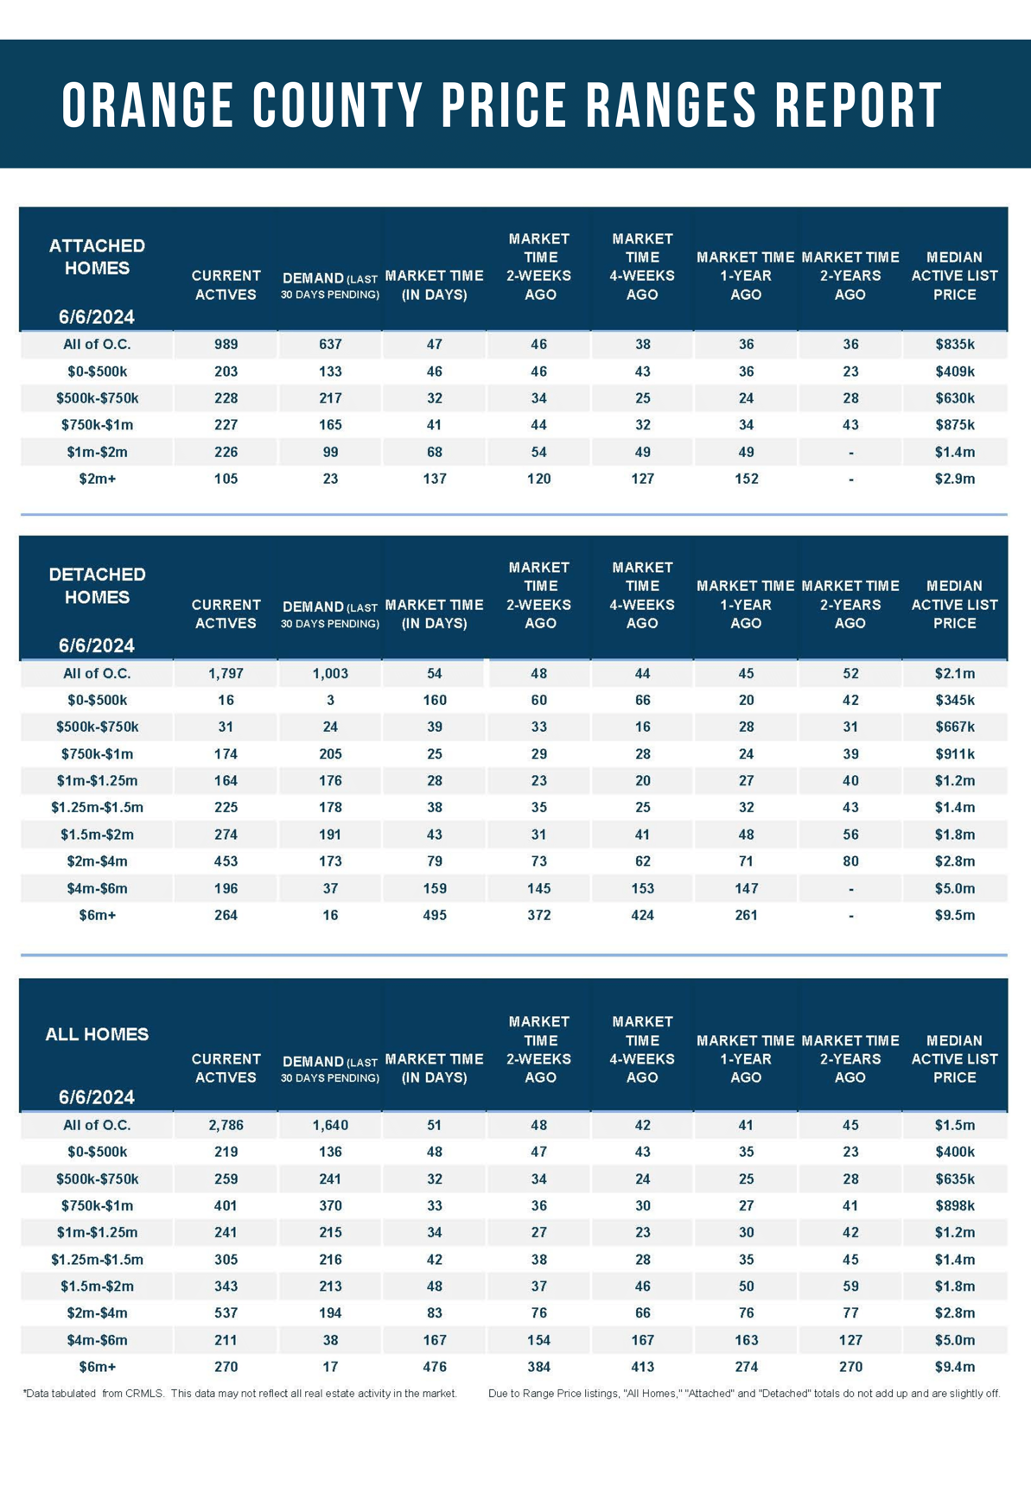
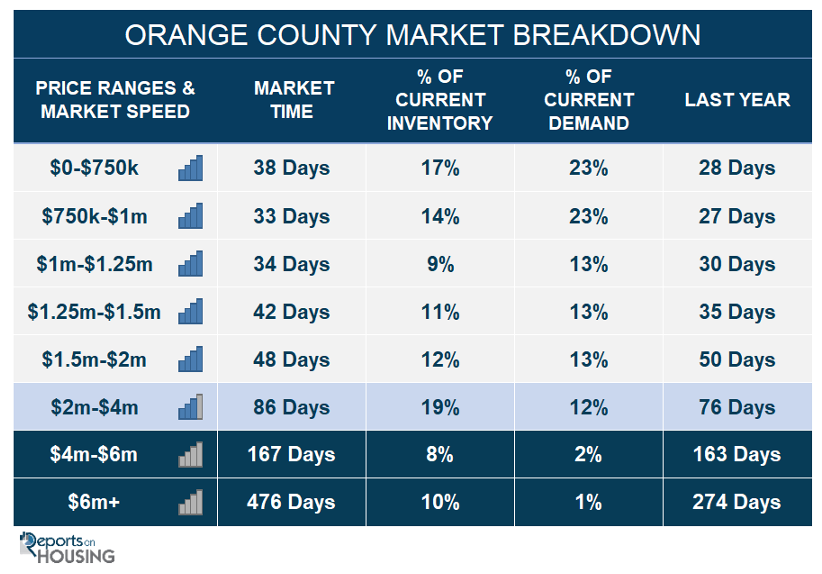
- In the past two weeks, the Expected Market Time for homes priced below $750,000 decreased from 39 to 38 days. This range represents 17% of the active inventory and 23% of demand.
- The Expected Market Time for homes priced between $750,000 and $1 million decreased from 36 to 33 days. This range represents 14% of the active inventory and 23% of demand.
- The Expected Market Time for homes priced between $1 million and $1.25 million increased from 27 to 34 days. This range represents 9% of the active inventory and 13% of demand.
- The Expected Market Time for homes priced between $1.25 million and $1.5 million increased from 38 to 42 days. This range represents 11% of the active inventory and 13% of demand.
- The Expected Market Time for homes priced between $1.5 million and $2 million increased from 37 to 48 days. This range represents 12% of the active inventory and 13% of demand.
- In the past two weeks, the expected market time for homes priced between $2 million and $4 million increased from 76 to 86 days. For homes priced between $4 million and $6 million, the Expected Market Time increased from 154 to 167 days. For homes priced above $6 million, the Expected Market Time increased from 384 to 476 days.
- The luxury end, all homes above $2 million, account for 37% of the inventory and 15% of demand.
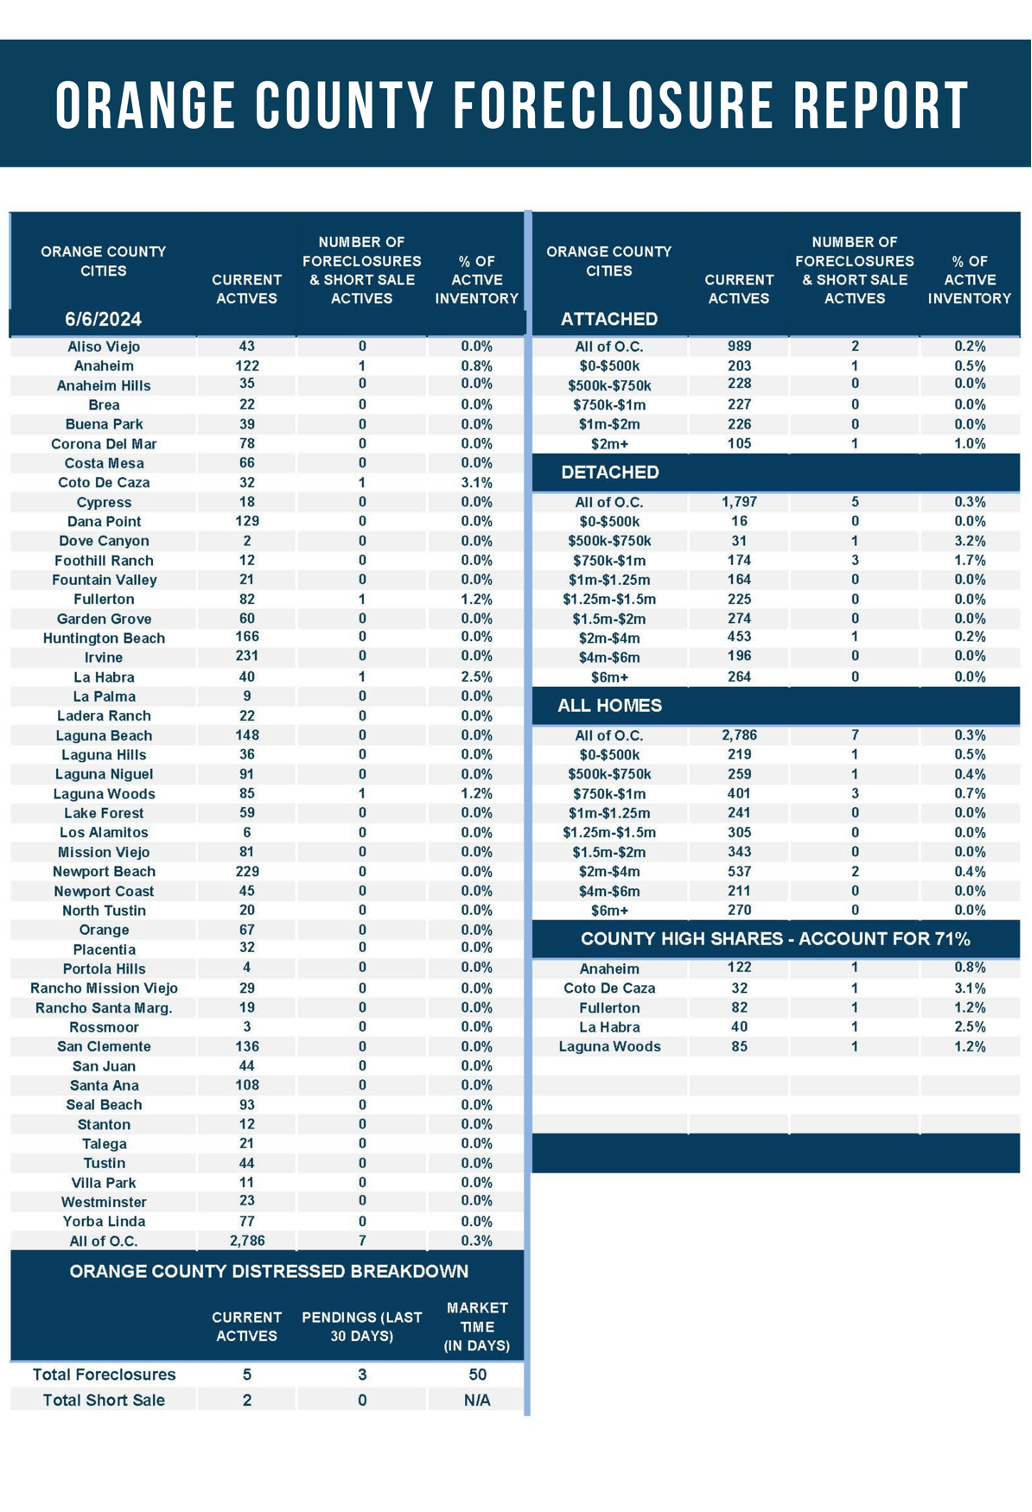
- Distressed homes, both short sales and foreclosures combined, comprised only 0.3% of all listings and 0.2% of demand. Only five foreclosures and two short sales are available today in Orange County, with seven total distressed homes on the active market, up one from two weeks ago. Last year, eight distressed homes were on the market, similar to today.
- There were 1,968 closed residential resales in April, up 16% compared to April 2023’s 1,696, and up 10% from March 2024. The sales-to-list price ratio was 100.4% for Orange County. Foreclosures accounted for 0.05% of all closed sales, and short sales accounted for 0.15%. That means that 99.8% of all sales were good ol’ fashioned sellers with equity.
Have a great week.
Sincerely,
Steven Thomas
Quantitative Economics and Decision Sciences
Copyright 2024—Steven Thomas, Reports On Housing—All Rights Reserved. This report may not be reproduced in whole or in part without express written permission from the author.