November 18, 2021
WITH AN ASTONISHINGLY LIMITED SUPPLY OF AVAILABLE HOMES
TO PURCHASE MATCHED UP WITH BLISTERING HOT DEMAND DUE
TO RECORD LOW MORTGAGE RATES, THE OVERALL HOUSING
MARKET IN ORANGE COUNTY IS INSANELY HOT.

Everyone put on their favorite pair of shorts, grabbed their flip flops, applied sunscreen, and enjoyed the usual summer activities of sunny Southern California. From the beach, to the pool, to mountain hikes, there is plenty to do when the temperature eclipses 90 degrees. Yet, it is not the middle of summer. It is a heatwave in the middle of November, just a couple of weeks until Thanksgiving. Occasionally, Mother Nature cooks up summer weather at this time of year.
Housing has been dealing with an unrelenting heat wave of its own since last year. After coming out of the COVID lockdown protocols, the inventory dropped, demand soared, and housing reached record breaking temperatures from July through the end of 2020. It never cooled. In fact, the 37-day Expected Market Time reached in December (the time between hammering in the FOR-SALE sign to opening escrow) was the hottest level of the year for Orange County. In 2021, temperatures climbed to levels never seen before, housing grew hotter, and the market time dove to 21 days on April 1st, the hottest reading since tracking began in 2004. Today’s 23-day Expected Market Time is the lowest for mid-November by far, and not much different than April. The heat wave is intense and will continue through the end of 2021, setting up a remarkably hot start to 2022, much hotter than this year’s start.
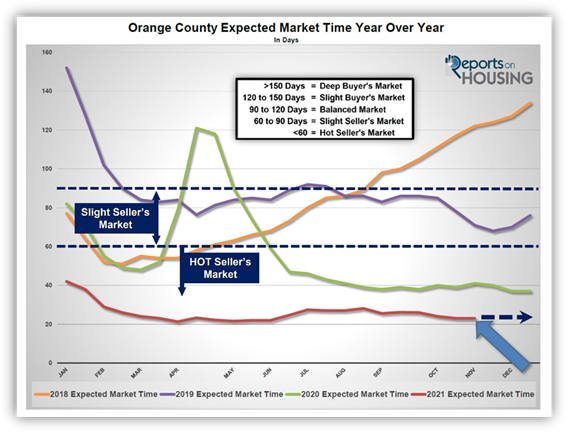
The Expected Market Time is the speed of the market, the lower the number, the faster homes are being placed into escrow. Anything below 60-days is considered a Hot Seller’s Market where there are plenty of showings, multiple offers, sellers call the shots, and home values are on the rise. A new level emerged to adequately describe this year’s heat wave, more intense than the record temperatures reached last year. Anything below 40-days is considered an Insane Seller’s Market. That is a market with a flood of showings, an overwhelming number of multiple offers, sellers get just about everything their hearts desire in calling the shots, and home values soar. Yes, despite all the news about flattening median sales prices (not an accurate gauge of home values anyways) and buyers less willing to enter bidding wars, home values are still on the rise today, in the middle of November just days before the start to the Holiday Market.
The beginning of the Holiday Market is at the end of this week, the start to the Thanksgiving recess for schools. That is when housing shifts from the Autumn Market when both the inventory and demand slowly but surely drop at a very similar pace, to the Holiday Market when both the supply of homes available to purchase and buyer demand plunge.
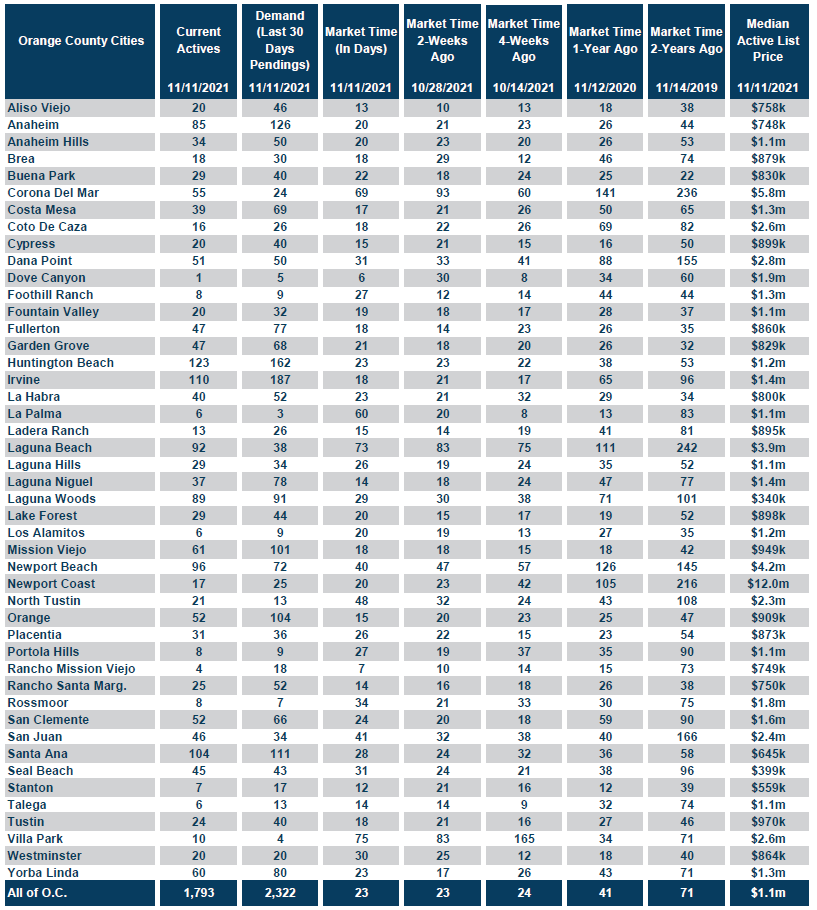
Today’s supply of available homes to purchase is at 1,793, the lowest level since tracking began in 2004. It is hard to imagine that the inventory will “plunge” from here, but it will most likely drop below 1,500 homes by year’s end. The fewest number of homes come on the market in the month of December, 63% fewer compared to the peak month of May (5-year average from 2015 through 2019, prior to the pandemic). The second fewest occurs in November, 46% fewer than May. Also, many unsuccessful sellers throw in the towel during the holidays and opt to wait until next year to try again. It is hard to believe, but 41% of the active inventory, 739 homes, have been on the market for more than a month. These are the sellers most apt to throw in the proverbial towel.
During the holidays, many buyers who have written offer after offer for months to no avail will place their home searching efforts on hold so that they can enjoy the festivities of the season. Yet, there will still be plenty of buyers willing and able to participate in the housing market fueled by the promise of cashing in on today’s historically low interest rate environment. Unfortunately, with such a limited inventory, the number of potential escrows will drop. Demand, a measure of recent new escrow activity, will plunge to its lowest level of the year upon ringing in the New Year.
A drop in demand does not mean that there will not be a ton of showings, multiple offers, and homes selling for at or above their asking prices. It means that there will be fewer buyers in the marketplace who are competing against each other for far fewer available homes to purchase. There are disproportionately more buyers than there are homes to purchase. Today’s Insane Seller’s Market is not going anywhere. Rather, it is setting up an extremely hot market to start 2022. It will be an Insane Seller’s Market from January 1st on. Last year there were 2,522 homes available on January 1. Upon celebrating the coming New Year, there will be less than 1,500 homes, 41% fewer than the start to this year. Match a record low supply with overabundant demand juiced by low mortgage rates, and housing will remain hot through the spring of 2022.
Active Listings
The current active inventory declined another 4% in the past two weeks.
The active listing inventory shed 71 homes in the past couple of weeks, down 4%, and now sits at 1,793 homes, the lowest level since tracking began in 2004. That is an unbelievably low level of homes for mid-November. For perspective, last year there were 3,843 homes at this time, 114% more, in 2019 there were 5,534 homes, 209% more, and in 2018 there were 7,218 homes, 302% more. That is correct, in 2018 there were four times the number of homes compared to today. It is hard to articulate just how acute the supply crisis has been this year, but it has underscored the incredible rise in home values and foreshadows continued appreciation to come. With the start of the Holiday Market, expect the
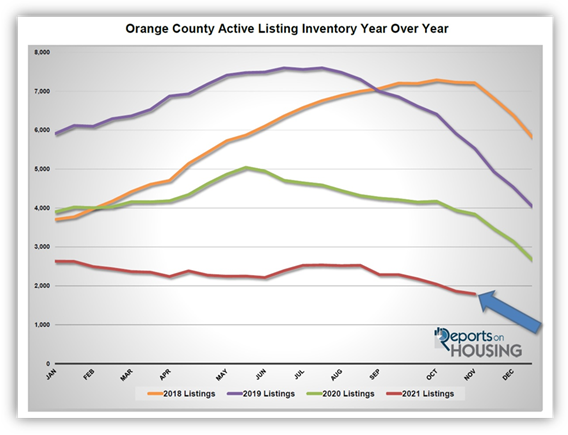
inventory levels to plunge and drop below 1,500 homes by year’s end, at least another 17% lower than today. That will be on the back of fewer homes coming to market and unsuccessful sellers pulling their homes off the market and waiting until next year.
The 3-year average from 2017 to 2019 (intentionally omitting 2020 due to COVID skewing the data) is 5,822, an extra 4,029 homes, or 225% more, triple compared to today. There were a lot more choices back then.
For October, there were 408 fewer new FOR-SALE signs in Orange County compared to the 3-year average from 2017 to 2019, 14% less. Every single missing sign just exacerbates the inventory crisis.
Demand
Demand dropped by 4% in the past couple of weeks.
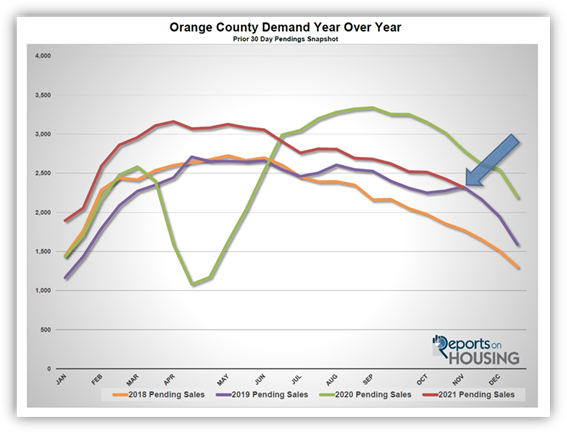
Demand, a snapshot of the number of new escrows over the prior month, decreased from 2,429 to 2,322 in the past couple of weeks, shedding 107 pending sales, down 4%. At this point the limited supply of available homes is eating into the potential number of escrows. True demand, the number of buyers in the marketplace, is a lot higher than tracked demand based upon escrow activity. True demand is impossible to gauge, but the throngs of showings for just about every home that hits the market combined with the sheer volume of multiple offers generated illustrates that there is a vast pool of buyers looking to secure a home. Expect demand to continue to plunge with the start of the Holiday Market simply due to a dropping supply of homes. From now until New Year’s Eve, demand will sink to its lowest levels of the year. It will rise again in January after celebrating the start to 2022.
Last year, demand was at 2,799, 21% more than today due to a four-month delay in the Spring Market because of COVID. The 3-year average prior to COVID (2017 to 2019) is 2,139 pending sales, 8% less than today. With a similar drop in both supply and demand, the Expected Market Time (the number of days to sell all Orange County listings at the current buying pace) remained unchanged at 23 days, an extremely insane, HotSeller’s Market (less than 60 days) where there are a ton of showings, sellers get to call the shots during the negotiating process, multiple offers are the norm, and home values are rising rapidly. The lowest level of the year occurred on April 1st at 21 days, not much different than today. Last year the Expected Market Time was at 41 days. The 3-year average prior to COVID was at 85 days, much slower than today, but still a Slight Seller’s Market.
Luxury End
The luxury market improved dramatically in the past couple of weeks with a giant drop in the supply of available luxury homes to purchase.
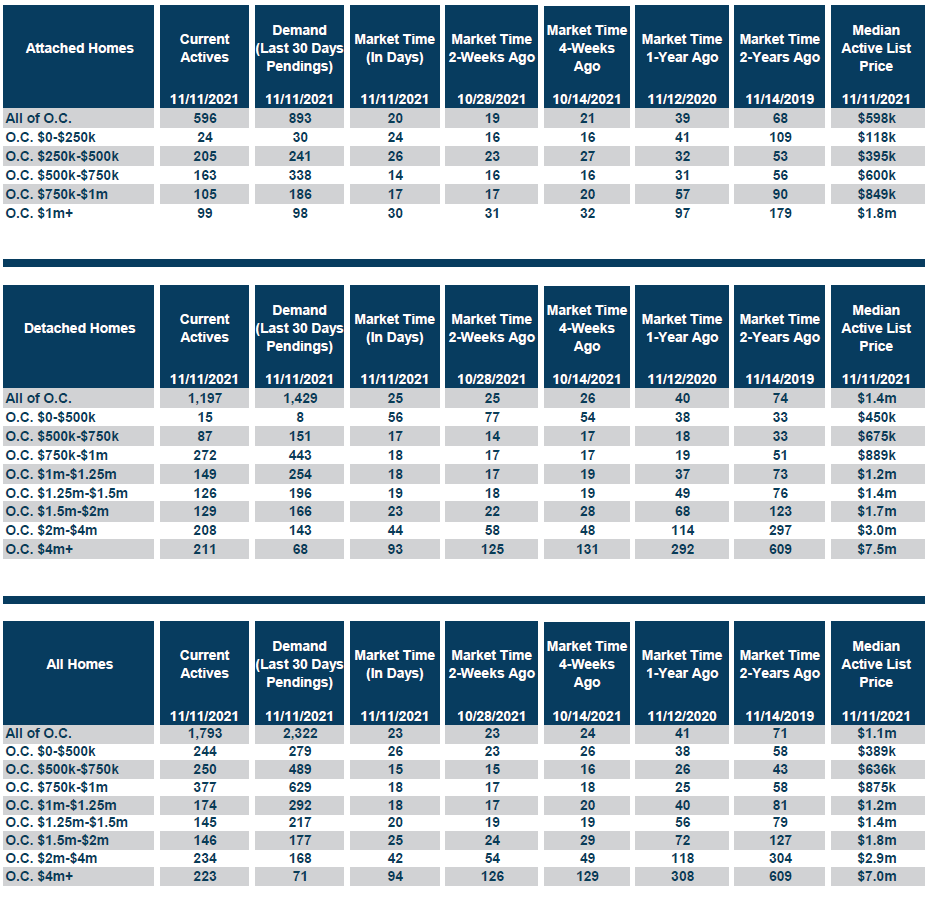
In the past two weeks the luxury inventory of homes priced above $1.5 million decreased by 69 homes, down 10%, and now sits at 603, its largest drop of the year and the lowest level since tracking began. Luxury demand increased by 20 pending sales, up 5%, and now sits at 416. With a large drop in the supply and an increase in demand, the overall Expected Market Time for luxury homes priced above $1.5 million plunged from 51 to 43 days, its lowest level since tracking began and a very Hot Seller’s Market for luxury.
Year over year, luxury demand is up by 105 pending sales or 34%, and the active luxury listing inventory is down by 638 homes or 51%. The Expected Market Time last year was at 120 days, extremely hot for luxury, but nearly three times where it stands today, indicating just how unbelievably hot the luxury market is right now.
For homes priced between $1.5 million and $2 million, the Expected Market increased from 24 to 25 days. For homes priced between $2 million and $4 million, the Expected Market Time decreased from 54 to 42 days. For homes priced above $4 million, the Expected Market Time decreased from 126 to 94 days. At 94 days, a seller would be looking at placing their home into escrow around February 2022.
Orange County Housing Summary
- The active listing inventory shed 71 homes in the past two weeks, down 4%, and now totals 1,793 homes, its lowest level since tracking. In October, there were 14% fewer homes that came on the market compared to the 3-year average prior to COVID (2017 to 2019), 408 less. Last year, there were 3,843 homes on the market, 2,050 additional homes, or 114% more.
- Demand, the number of pending sales over the prior month, decreased by 107 pending sales in the past two weeks, down 4%, and now totals 2,322. Last year, there were 2,799 pending sales, 21% more than today due to a four-month delay in the Spring Market because of COVID.
- With a similar drop in both supply and demand, the Expected Market Time, the number of days to sell all Orange County listings at the current buying pace, remained unchanged at 23 days in the past couple of weeks, an extremely Hot Seller’s Market (less than 60 days). It was at 41 days last year, slower than today.
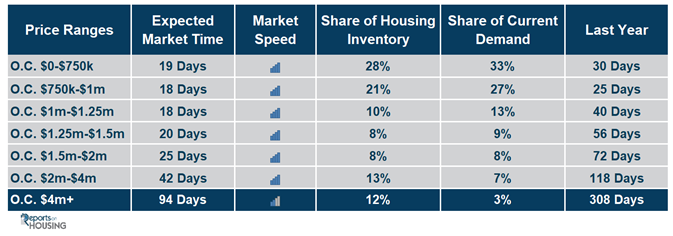
- For homes priced below $750,000, the market is a Hot Seller’s Market (less than 60 days) with an Expected Market Time of 19 days. This range represents 28% of the active inventory and 33% of demand.
- For homes priced between $750,000 and $1 million, the Expected Market Time is 18 days, a Hot Seller’s Market. This range represents 21% of the active inventory and 27% of demand.
- For homes priced between $1 million to $1.25 million, the Expected Market Time is 18 days, a Hot Seller’s Market. This range represents 10% of the active inventory and 13% of demand.
- For homes priced between $1.25 million to $1.5 million, the Expected Market Time is 20 days, a Hot Seller’s Market. This range represents 8% of the active inventory and 9% of demand.
- For homes priced between $1.5 million and $2 million, the Expected Market increased from 24 to 25 days. For homes priced between $2 million and $4 million, the Expected Market Time decreased from 54 to 42 days. For homes priced above $4 million, the Expected Market Time decreased from 126 to 94 days.
- The luxury end, all homes above $1.5 million, accounts for 33% of the inventory and 18% of demand.
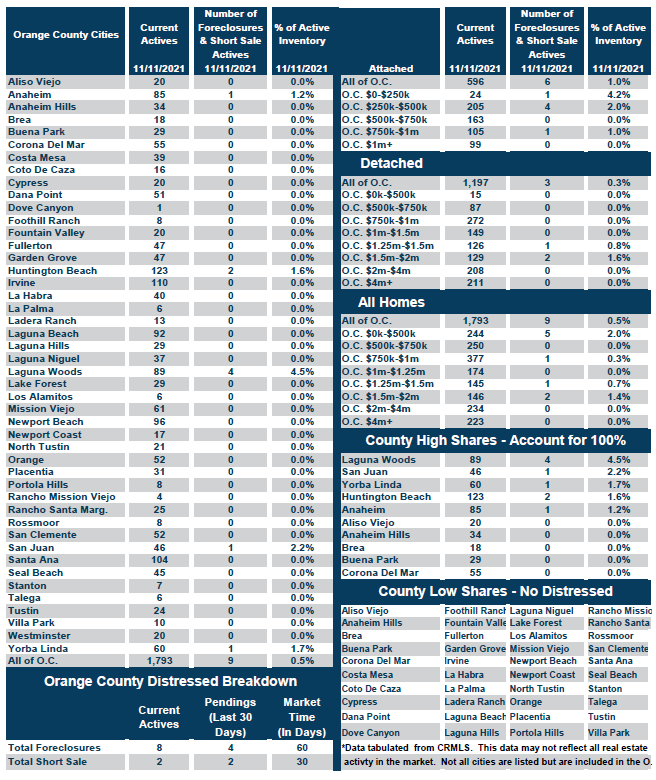
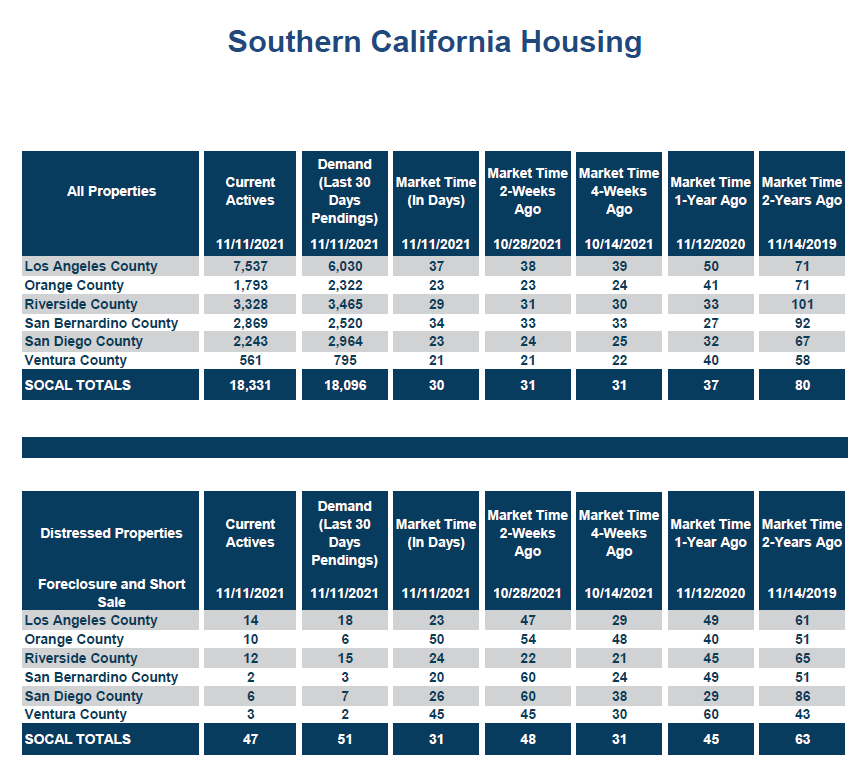
- Distressed homes, both short sales and foreclosures combined, made up only 0.6% of all listings and 0.3% of demand. There are only 8 foreclosures and 2 short sales available to purchase today in all of Orange County, 10 total distressed homes on the active market, up 1 from two weeks ago. Last year there were 12 total distressed homes on the market, similar to today.
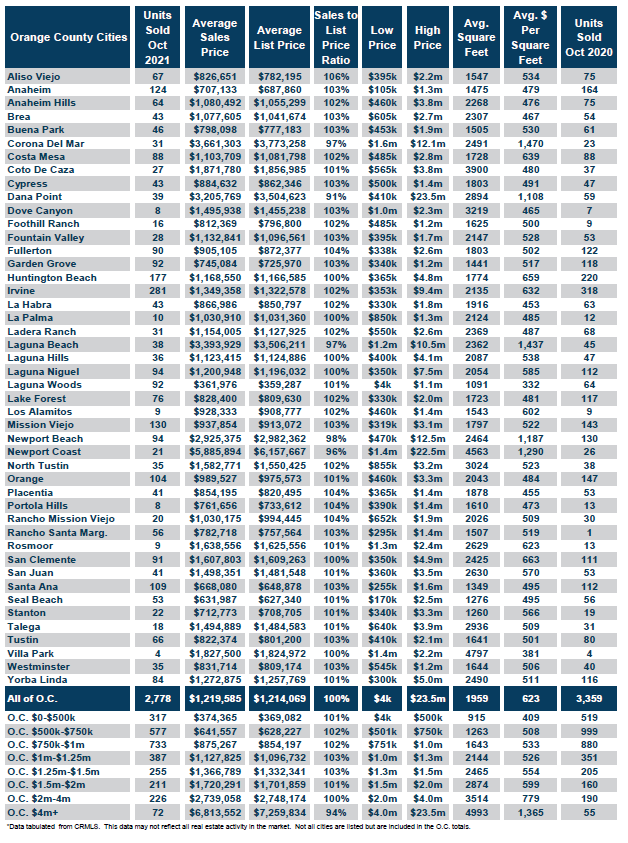
- There were 2,778 closed residential resales in October, 17% less than October 2020’s 3,359 closed sales. For the year, through October, there have been 30,097 closed sales, 23% higher than last year. September marked a 7% drop compared to September 2021. The sales to list price ratio was 100.5% for all of Orange County. Foreclosures accounted for just 0.29% of all closed sales, and short sales accounted for 0.04%. That means that 99.7% of all sales were good ol’ fashioned sellers with equity.
Have a great week.
Sincerely,
Steven Thomas
Quantitative Economics and Decision Sciences
Cell 949.874.8221
Copyright 2021- Steven Thomas, Reports On Housing – All Rights Reserved. This report may not be reproduced in whole or part without express written permission by author.