July 26, 2021
Ever since the Great Recession, far fewer homeowners have been
selling their homes annually, and now even fewer are opting
to participate in selling their homes.
Lack of Sellers
Fewer homeowners are opting to sell despite homes appreciating to record levels.
This is the time of year when Southern Californians flock to the beach to escape the heat and enjoy the cool surf of the Pacific Ocean. After a long day of jumping in and out of the water, chasing the waves, building sandcastles, and basking in the warmth of the sun, many experienced beach goers realize that they forgot to reapply sunscreen. Upon returning home and gazing in the mirror, they quickly confirm that they have a lobster red sunburn from head to toe. Nearly everybody has experienced the pain of this sunburn. The pain is a helpful reminder to never forget to reapply sunscreen again.
Similarly, homeowners across the nation watched the housing market take a brutal pounding during the Great Recession as their equity vanished in a blink. Many lost their homes to foreclosures or short sales. Everybody was either personally burned or they knew somebody who experienced the painful sting of the downturn. As a result, a new trend emerged to avoid that lobster red burn with staying power: homeowners remain in their homes for a lot longer. They are content in keeping their home. There are fewer homeowners who opt to sell every year, and even with record home values, the trend continues.
From 2000 to 2008, there were an average of 1,347 more homes that came on the market every single month compared to the past 10 years. That is an extra 16,158 sellers every year, 39% more. That has been the storyline for more than a decade, not enough homes are offered for sale. It is not just an Orange County phenomenon or isolated to just Southern California. Nor is it unique to the state of California. A lack of sellers has been a national issue that has plagued the real estate market and made it very difficult for buyers to isolate a home.
The lack of supply and years of red-hot demand, juiced by record low interest rates (especially since the start of the COVID-19 pandemic), has resulted in homes appreciating to record levels in Orange County, erasing the losses and sting of the Great Recession entirely. This more than a decade long trend is now the norm. Homeowners are not moving as often as they used to.
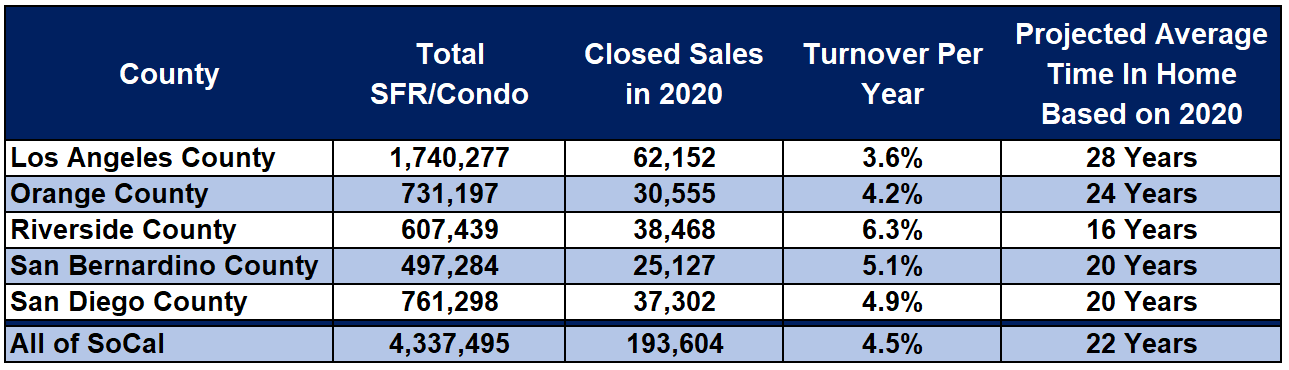
Based upon 2020 closed sales, the turnover rate for the Orange County’s housing stock is once every 24 years, down slightly from 2019’s once every 25 years. It has bounced between 20 years and 25 years for the past decade. Remarkably, only 4.1% of all homeowners opted to sell their homes last year.
There are numerous reasons why homeowners in Orange County and across the nation are opting to stay put. After feeling the burn from the Great Recession, many are turning their homes into “Forever Homes.” Most homeowners have refinanced to historically low interest rates, some as low as the mid-twos, making moving a lot more challenging as rates eventually rise. Most baby boomers plan on staying put instead of downsizing after retirement. They are not moving like many had originally anticipated. They have been selling at a much slower pace than prior generations. This may be due to a longer life expectancy and a healthier lifestyle. They are happy just aging in place. And builders have not been building homes in the lower price ranges like they did in prior decades. These factors combined have contributed to the low turnover rate in the housing stock.
COVID-19 intensified the trend of fewer homeowners opting to sell. Last year in Orange County, 6% fewer homes were placed on the market compared to the prior 5-year average from 2015 to 2019. That translates to 2,535 missing FOR-SALE signs. That paved the way to 2021’s lowest active listing inventory since tracking began in 2004. Today, it is not COVID that is keeping homeowners from selling, it is the lack of replacement homes after selling. Many are pointing to the fact that if they sell there will be “nothing to buy,” limiting the number of homeowners willing to participate in a market with such an anemic level of available homes to purchase. In the first half of 2021, 8% fewer homes were placed on the market compared to the 5-year average from 2015 to 2019 (intentionally excluding 2020 due to COVID skewing the data), 1,829 fewer FOR-SALE signs.
Buyers must understand that the low turnover rate in the housing stock is here to stay. The pandemic did not help the issue either. This trend is here to stay, which means that the anemic inventory is not going to change much for the rest of the year and into 2022 as well. Most homeowners are simply content with staying put. As a buyer, waiting for a lot more choices is futile. Buyers that opt to wait will be kicking themselves down the road. Instead, cashing in on today’s historically low rates now is the right move. The housing market has the legs to continue at its current trajectory for quite some time.
Active Listings
The current active inventory was nearly unchanged in the past couple of weeks.
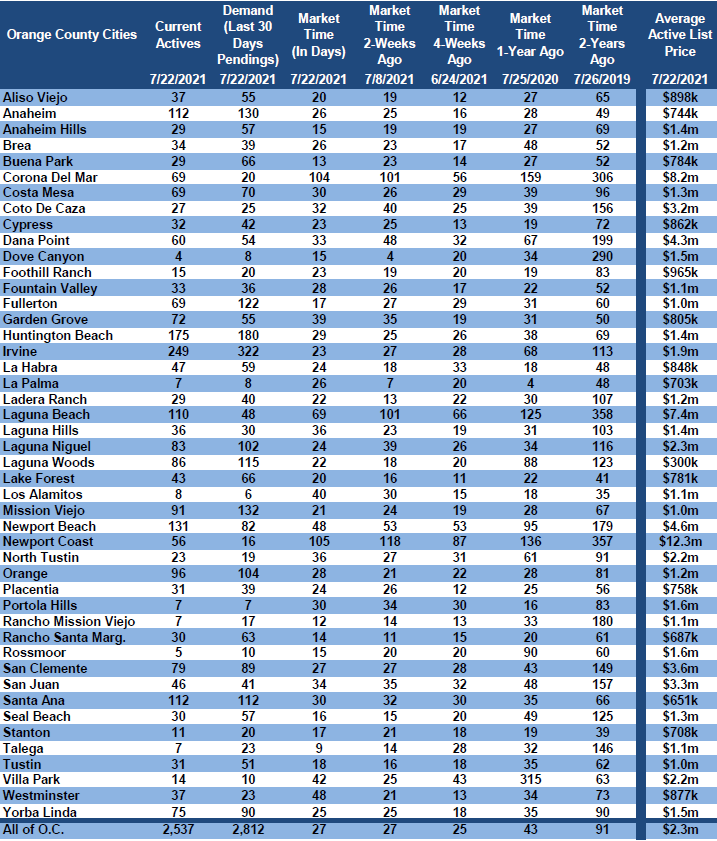
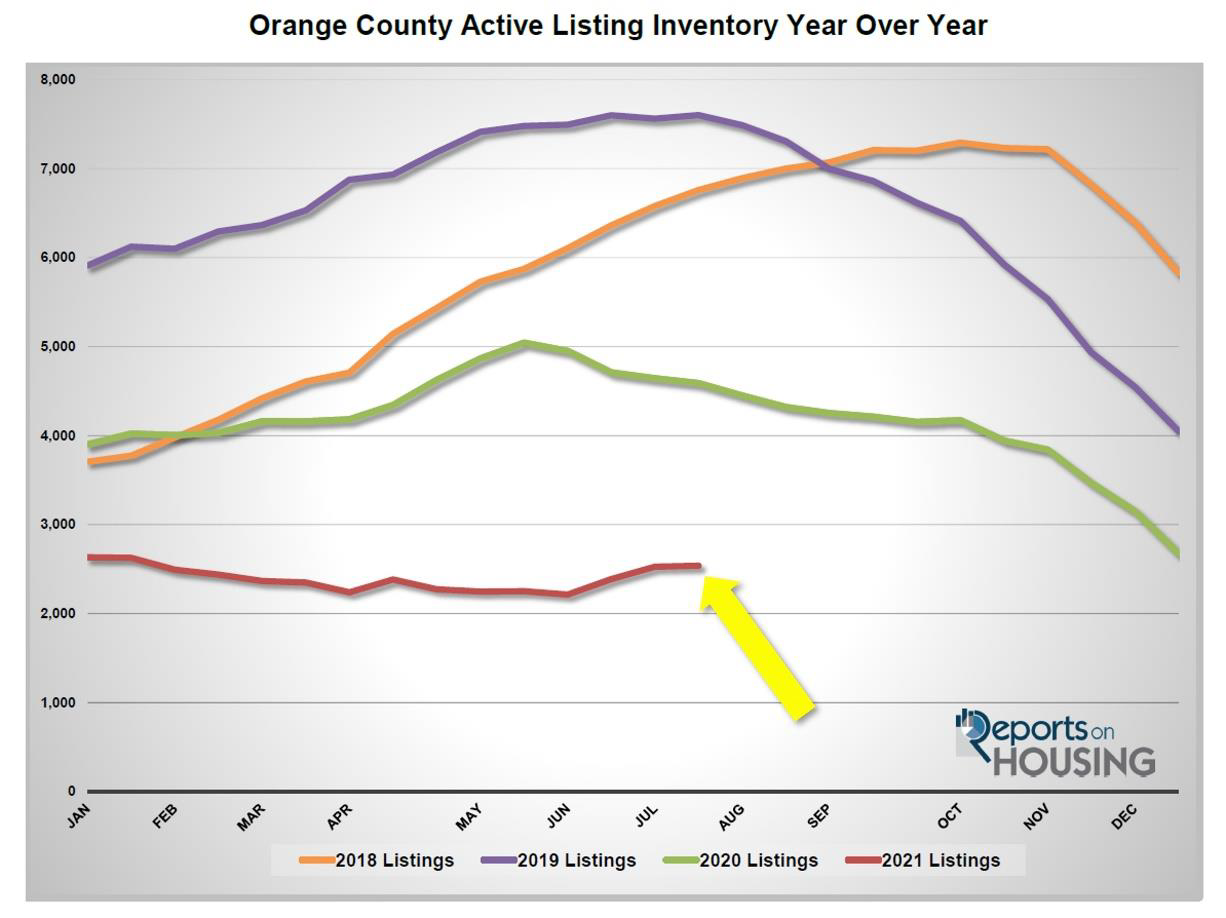
The active listing inventory added 9 homes in the past couple of weeks, nearly unchanged, and now sits at 2,537 homes, its highest level since January. This year is following a normal, cyclical, seasonal pattern with an increase in the active listing inventory during the Summer Market. Typically, during the Autumn Market, which starts at the end of August with the kids going back to school, fewer homeowners opt to place their homes on the market. It is more disruptive to a family in placing a home on the market after school resumes. This year may be a bit different as many homeowners may decide to take advantage of housing’s strength, which would mean that the active inventory would continue to climb and peak later in the year. The inventory typically peaks between July and August, but this year may be an exception, only time will tell.
Last year at the end of July, there were 4,590 homes on the market, 2,053 additional homes, or 81% more. The 5-year average from 2015 to 2019 (intentionally omitting 2020 due to COVID skewing the data) is 6,916, an extra 4,379 homes, or 173% more. There were a lot more choices for buyers compared to today.
Demand
Demand increased by 2% in the past couple of weeks.
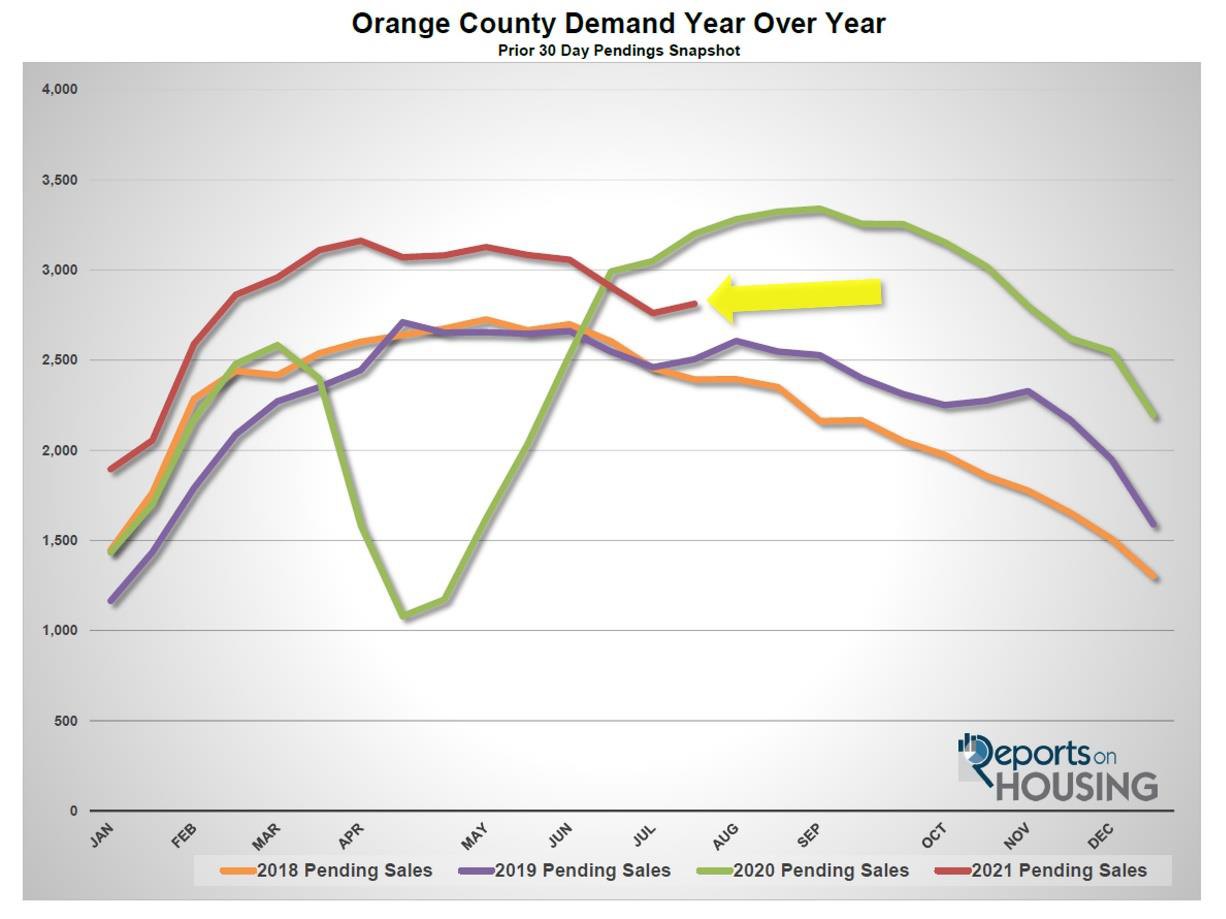
Demand, a snapshot of the number of new pending sales over the prior month, increased from 2,761 to 2,812 in the past couple of weeks, adding 51 pending sales, up 2%. It is still down 11% since peaking back on April 1st at 3,162 pending sales. Demand will continue to slowly descend from now through the Summer and Autumn Markets. It will then pick up steam and fall at a much faster pace during the Holiday Market beginning the week prior to Thanksgiving. Orange County demand is following a normal cyclical pattern this year, peaking during the Spring Market and then slowing dropping after reaching its peak.
Last year, demand was at 3,200, 14% more than today, with the arrival of a very late Spring Market due to COVID. It is better to compare today’s market to the 5-year average for demand from 2015 through 2019, which was at 2,682 pending sales, 145 fewer pending sales, or 5% less than today.
With the inventory rising slightly and demand rising as well, in the past two-weeks the Expected Market Time (the number of days to sell all Orange County listings at the current buying pace) remained unchanged at 27 days, its highest level since the start of February. At 27 days, it is an extremely insane, Hot Seller’s Market (less than 60 days) where there are a ton of showings, sellers get to call the shots during the negotiating process, multiple offers are the norm, and home values are rising rapidly. Last year the Expected Market Time was at 43 days and dropping. The 5-year average from 2015 through 2019 was at 78 days, much slower than today, but still a Slight Seller’s Market.
Luxury End
The luxury market improved with a drop in the supply of available homes to purchase.
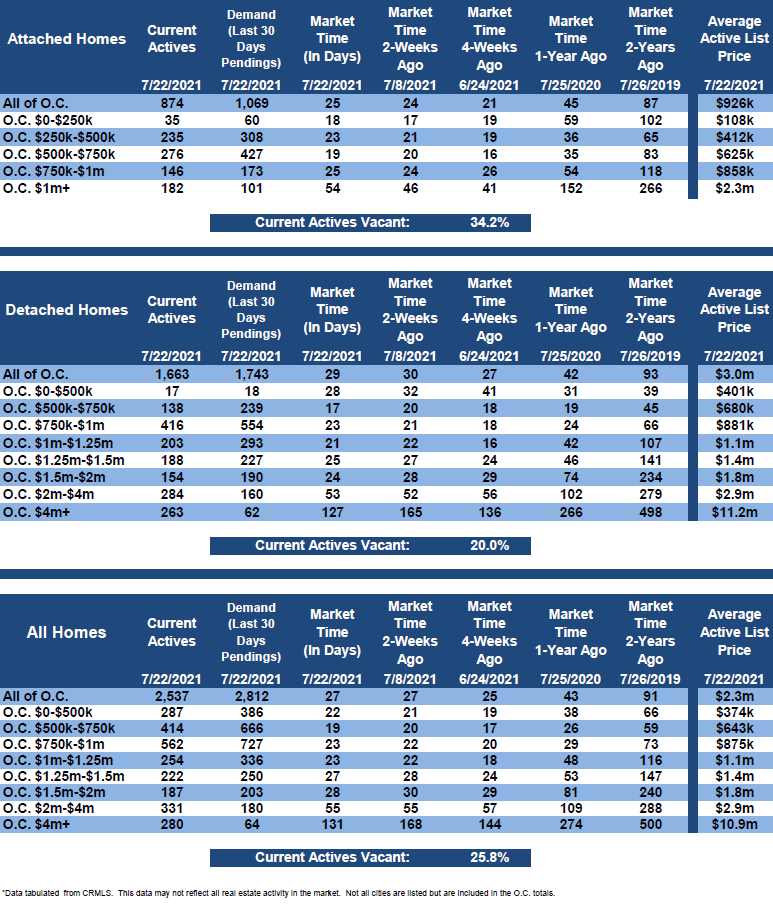
In the past two weeks the luxury inventory of homes priced above $1.5 million decreased by 40 homes, down 5%, and now sits at 798. At the same time, luxury demand increased by 1 pending sale, nearly unchanged, and now sits at 447. With a decrease in the supply of luxury homes, the overall Expected Market Time for luxury homes priced above $1.5 million decreased from 56 to 54 days. At 54 days, it remains a very Hot Seller’s Market for luxury.
Expect the luxury market to slightly cool with all the distractions of summer.
Year over year, luxury demand is up by 86 pending sales, or 24%, and the active luxury listing inventory is down by 612 homes, or 43%. The Expected Market Time last year was at 117 days and plunging fast due to the delay in the Spring Market due to COVID. Year over year statistics for luxury are a lot more comparable today than they have been for a while. It indicates that today’s luxury market is the hottest on record.
For homes priced between $1.5 million and $2 million, the Expected Market Time decreased from 30 to 28 days. For homes priced between $2 million and $4 million, the Expected Market Time remained unchanged at 55 days. For homes priced above $4 million, the Expected Market Time decreased from 168 to 131 days. At 131 days, a seller would be looking at placing their home into escrow around December 2021.
Orange County Housing Summary
• The active listing inventory increased by 9 homes in the past two-weeks, nearly unchanged, and now totals 2,537, its highest level since January. In June, there were 12% fewer homes that came on the market compared to 5-year average between 2015 to 2019 (2020 was skewed do to COVID-19), 476 less. Last year, there were 4,590 homes on the market, 2,053 additional homes, or 81% more.
• Demand, the number of pending sales over the prior month, increased by 51 pending sales in the past two-weeks, up 2%, and now totals 2,812. Last year, there were 3,200 pending sales, 14% more than today, due to a delayed Spring Market.
• With a slight increase in the supply and an increase in demand, the Expected Market Time, the number of days to sell all Orange County listings at the current buying pace, remained unchanged at 27 days in the past couple of weeks, its highest level since February, but still an extremely Hot Seller’s Market (less than 60 days). It was at 43 days last year and getting hotter.
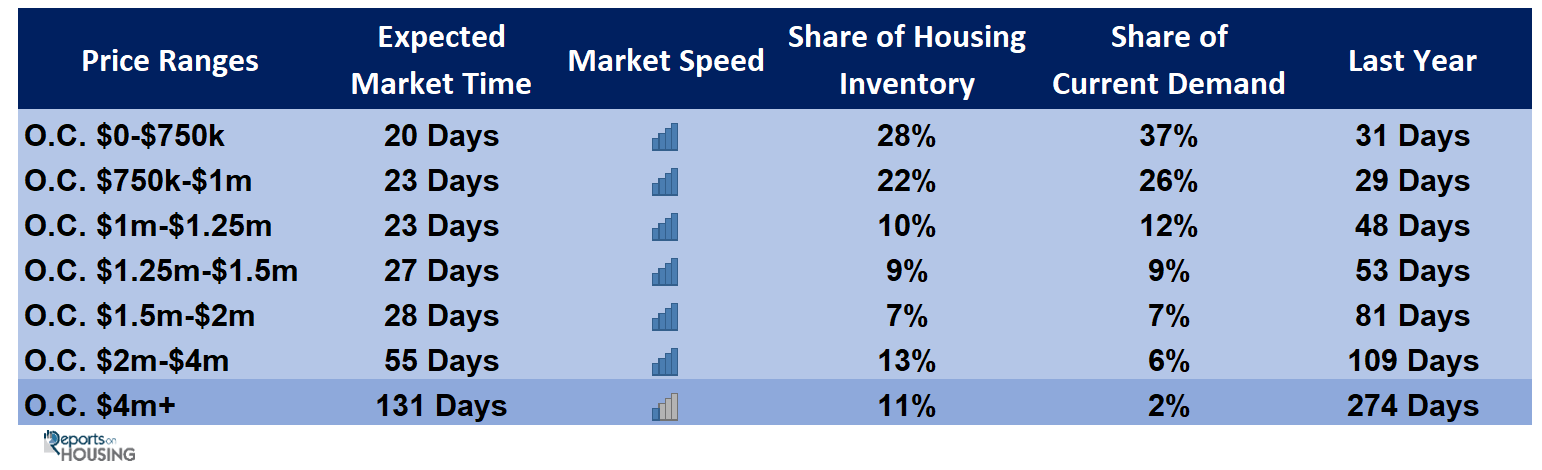
• For homes priced below $750,000, the market is a Hot Seller’s Market (less than 60 days) with an Expected Market Time of 20 days. This range represents 28% of the active inventory and 37% of demand.
• For homes priced between $750,000 and $1 million, the Expected Market Time is 23 days, a Hot Seller’s Market. This range represents 22% of the active inventory and 26% of demand.
• For homes priced between $1 million to $1.25 million, the Expected Market Time is 23 days, a Hot Seller’s Market. This range represents 20% of the active inventory and 12% of demand.
• For homes priced between $1.25 million to $1.5 million, the Expected Market Time is 28 days, a Hot Seller’s Market. This range represents 9% of the active inventory and 9% of demand.
• For homes priced between $1.5 million and $2 million, the Expected Market Time decreased from 30 to 28 days. For homes priced between $2 million and $4 million, the Expected Market Time remained unchanged at 55 days. For homes priced above $4 million, the Expected Market Time decreased from 168 to 131 days.
• The luxury end, all homes above $1.5 million, accounts for 31% of the inventory and 15% of demand.
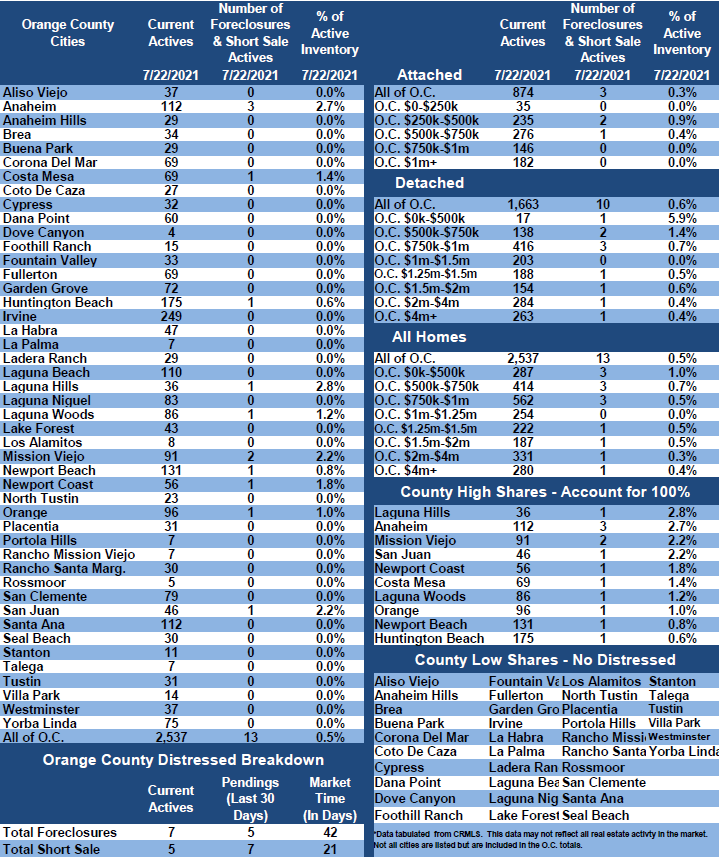
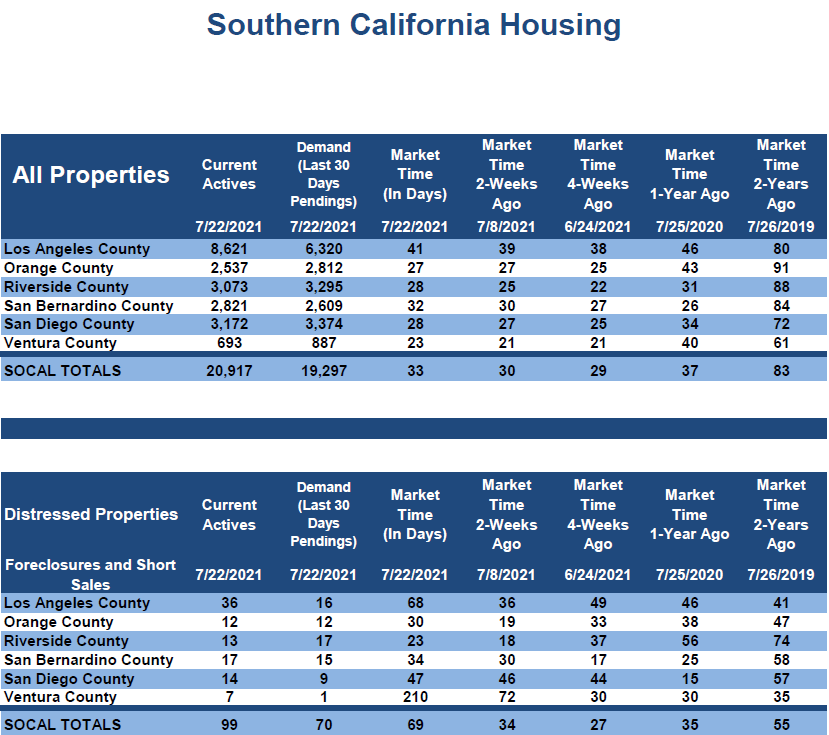
• Distressed homes, both short sales and foreclosures combined, made up only 0.5% of all listings and 0.4% of demand. There are only 7 foreclosures and 5 short sales available to purchase today in all of Orange County, 12 total distressed homes on the active market, up 5 from two-weeks ago. Last year there were 25 total distressed homes on the market, slightly more than today.
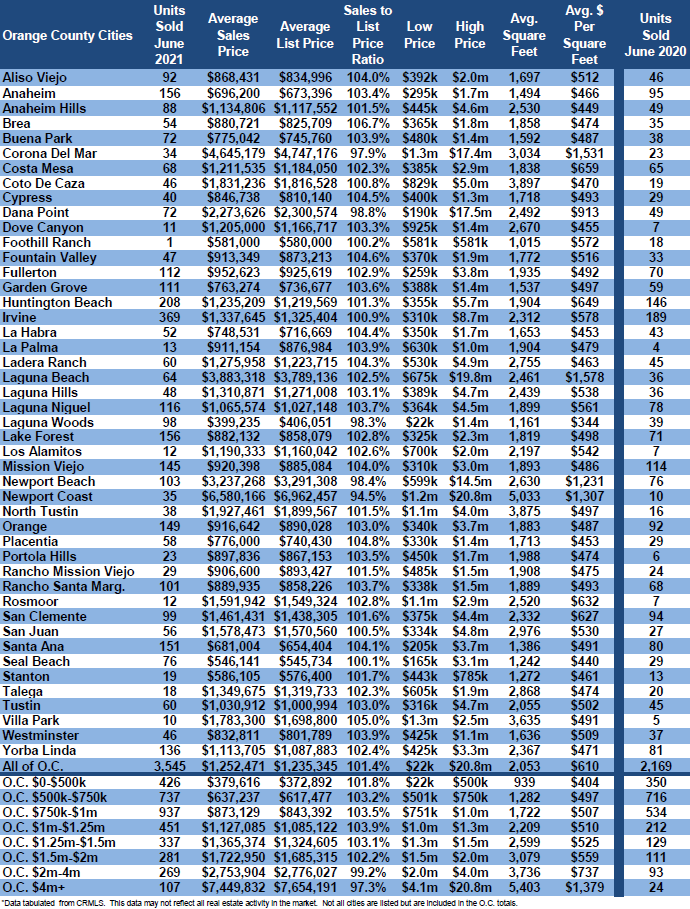
• There were 3,545 closed residential resales in June, 63% more than June 2020’s 2,169 closed sales. June marked a 10% increase compared to May 2021. The sales to list price ratio was 101.4% for all of Orange County. Foreclosures accounted for just 0.1% of all closed sales, and short sales accounted for 0.1%. That means that 99.8% of all sales were good ol’ fashioned sellers with equity.
Have a great week.
Sincerely,
Steven Thomas
Quantitative Economics and Decision Sciences
Cell 949.874.8221
Copyright 2021- Steven Thomas, Reports On Housing – All Rights Reserved. This report may not be reproduced in whole or part without express written permission by author.